


توڭلىتىلغان خېمىل ۋە مۇناسىۋەتلىك مېيىنىڭ خۇسۇسىيىتى (HPMC) نىڭ تەسىرى
توڭلىتىلغان خېمىرنىڭ بىر تەرەپ قىلىش خۇسۇسىيىتىنى ياخشىلاش, يۇقىرى سۈپەتلىك قۇلايلىق چۈشۈشنىڭ چوڭ تىپتىكى پارلىغۇچىسى بولكىنىڭ ئىپادىسى كەڭلىكىنى مەلۇم قىلىشنىڭ مەلۇم ئەمەلىي ئەھمىيىتى بار. بۇ تەتقىقاتتا, يېڭى تىپتىكى گىدروفىللىق كولوئىز (Hydroypropy Mythylcellulluy, Yang, MC) توڭلىتىلغان خېمىردەك ئىشلىتىلگەن. توڭلىتىلغان خېمىر, پىرسەنت خېمىر ۋە پارنى بىر تەرەپ قىلىش خۇسۇسىيىتىدە% 1,% 1,% 1)% 1,% 1,% 1,% 1)% 1. زاپچاسلارنىڭ قۇرۇلمىسى ۋە خۇسۇسىيىتىگە بولغان تەسىرى (بۇغداي گلۇتېن, بۇغداي كراخمال ۋە ئېچىتقۇچىلىق).
قىزىل تەرەپلىك ۋە سوزۇلغان تەجرىبەنىڭ ئۈلگىسى »نىڭ خېفىلنىڭ ھەرىكەتلەندۈرگۈچ كۈچى ۋە ئۇزۇن يىللىق قىستۇرمىلارنىڭ يۇقىرى كۆتۈرۈلگەنلىكى كۆرسىتىلدى, چېگرىنىڭ ئازابى بىلەن قوشۇلغاندا, توڭلىتىش بىر نەرسە مۇقىم بولدى. ئۇنىڭدىن باشقا, كونترول توپى بىلەن كونكرېت ھاۋا ۋە ئېلاستىك بولغان ئىممۇنىتتۇرۇلغان, توڭلىتىلغان خېمىر بىلەن% 2 HPMC بىلەن 20 كۈن باشلانغاندىن سېلىشتۇرغاندا قاتتىق ئاشتى.
بۇغداي گلۇتان خېمىر تورى قۇرۇلمىسىنىڭ شەكىللىنىشىنىڭ مۇۋاپىق ئاساسى. تەجرىبە بايقىشىچە, مەن قوشۇلغاندىن كېيىن, مەن - IPMC توڭلىتىش جەريانىدا ياڭاق يېتىشمەسلىك يولىنى ئازايتىدۇ ۋە بۇغاق يېغىل چىۋىن ئاجىز ئاقسىللارنى ئازايتىدۇ. بۇنىڭدىن باشقا, تۆۋەن قاتلاملىق يادرو ماگنىتاك رەت قىلىش نەتىجىسىنىڭ سۇ دۆلەت ئۆتۈلۈپ كېتىشى ۋە ئاساسەن سۈزۈكلەشتۈرۈش ۋە قايتا بېسىلۈشنىڭ نەتىجىلىرى ۋە خېمىرنىڭ يېغىشىنىڭ ئۆستۈرۈلىدىغان سۇنىڭ ئۈنۈمىنى بېسىدۇرا بولىدۇ. سايلاشنى سايىلەپ ئېلېكترون MicroSCOPE دا ئوكۇلتورىيە كۆرسەتتى, HPMC نىڭ Gluten تور قۇرۇلمىسىنىڭ مۇقىملىقىنى ساقلىشى مۇمكىنلىكىنى كۆرسىتىپ بېرىدۇ.
كراخمال بولسا خېمىردىكى ئەڭ كۆپ قۇرۇق ئىش, ئۇنىڭ قۇرۇلمىسىنىڭ ئۆزگىرىشى سۈتتىن ئايرىشنىڭ خاراكتېرى ۋە ئاخىرقى مەھسۇلاتنىڭ سۈپىتىگە بىۋاسىتە تەسىر كۆرسىتىدۇ. X. X نەينىڭ مىللىتىيىسىنىڭ نەتىجىسى ۋە DSC ستاتىستىكا كرېستنىڭ نىسپىي خرۇستاللىقى ۋە قىستىتا ئىس-تۈتەكلىك دورا مىقدارىنىڭ كۆپەيتىلگەن نۇسخىسى. توڭلىتىش ۋاقتىنى ئۇزارتىش بىلەن, HPMC بۇنىڭدىن Orekch نىڭ يوشۇرۇن كۈچى تەدرىجىي تۆۋەنلەپ, گراكتەك ھايۋاناتلاشتۇرۇش كۈچى (مۇشۇنداق تارىيىدىغان ئەڭ مۇلىنىدۇ, چىداملىق قىممەت, چىداملىق قىممەت ۋە قايتا كۆرۈش قىممىتى تۆۋەنلىدى ساقلاش ۋاقتى كەلگەندە, كونترول گۇرۇپپىغا سېلىشتۇرغاندا, HPMC دىن ئۆسۈشىگە سېلىشتۇرغاندا, Collecch Crychstast قۇرۇلمىسى ۋە زالىملاشتۇرۇش مۈلكىسىنىڭ ئۆزگىرىشى بار.
شەرەپلىك تەبىئىي گاز ئىشلەپچىقىرىش پائالىيىتى ۋەقەلەنگەن ئۇننىڭ سۈپىتىگە ئىنتايىن مۇھىم تەسىر كۆرسەتتى. سىناق قىلىش ئارقىلىق, كونترول گۇرۇپپىغا سېلىشتۇرغاندا, Hpmc نىڭ راز-ياراغ پائالىيىتىنى تېخىمۇ قوغلاپ چىقىرىش, HPMC نىڭ ئىشلىتىلىشى قوشۇلغان.
نەتىجىدە HPMC نىڭ توڭلىتىلغان خان جەمەتى, بىر تەرەپ قىلغۇچ خان جەمەتىنى ۋە ھورنىڭ سۈپىتىنى ئۆستۈرگەنلىكىنى كۆرسىتىپ بېرىدۇ.
ئاچقۇچلۇق سۆزلەر: ھور: نان توڭلىتىلغان خېمىر hydroxypropyl Mythylullouse; بۇغداي گلۇتېن; بۇغداي چولپانلار ئېچىتقۇ.
جەدۋەلنىڭ مەزمۇنى
Chapter 1 Preface ................................................................................................................................. 1
1.1 ئائىلە ۋە چەتئەلدىكى تەتقىقاتنىڭ ھازىرقى ھالىتى ........................................................... l
1.1.1 Mansuiqi نى تونۇشتۇرۇش
1.1.2 ھورلانغان پار-يۇندىلارنىڭ تەتقىقات ئەھۋالى ................................................................. . ............ 1
1.1.3 توڭلىتىلغان خېمىر تونۇشتۇرۇش .................................................................................................................... 2
1.1.4 توڭلىتىلغان خېمىرنىڭ مەسىلىسى ۋە قىيىنچىلىقى .............................................................................. .3
1.1.5 توڭلىتىلغان خېمىرنىڭ تەتقىقاتى ................................................. ...............................................
1.1.6 توڭلىتىلغان خېمىر سۈپىتىنى ياخشىلاشتا گىدروكولوزىتلىرىنى قوللىنىڭ ......................5
1.1.7 mydroxyprapyl mythyl melloupy (Hydroyspropyl Mythyl Smouluel, i-ipmc) .......... 5
112 Purpose and Significance of the Study ................................................................................ 6
1.3 The main content of the study ...................................................................................................7
2-باب توڭلىتىلغان خېمىرنىڭ بىر تەرەپ قىلىش خاسلىقى ۋە ھورلانغان بولكىنىڭ سۈپىتىنىڭ سۈپىتى بىلەن ئۇچرىشىشنىڭ تەسىرى ئاستىدا, نانقىچە بولكا سۈپىتى.
2.1 Introduction ...................................................................................................................................... 8
2.2 Experimental materials and methods ........................................................................................8
2.2.1 Experimental materials ................................................................................................................8
2.2.2 Experimental Instruments and Equipment .............................................................................8
2.2.3 Experimental methods ................................................................................................................ 9
2.3 تەجرىبە نەتىجىسى ۋە مۇلاھىزە ..................................................................................................................................................................................................................................... 11
2.3.1 بۇغداي ئۇننىڭ ئاساسىي زاپچاسلىرى كۆرسەتكۈچى ......................................................................................1
2.3.2 HPMC نىڭ خېمىردىن ئايرىلغان دېھقانچىلىق دورىلىرىنىڭ تەسىرىدىن باشقا HPMC نىڭ تەسىرى ........................11
2.3.3 HPMC نىڭ ھەشەمەتلىك زەھىرىدىن قوشۇلۇش خۇسۇسىيىتىدىن باشقا, .................................... 12
2.3.4 HPMC قوشۇشنىڭ ئۈنۈمى ۋە خېمىرنىڭ رولۇت خۇلاسىسى. ................................. .
FPMC قوشۇنىشتىن 2.3.5 ۋە توڭلىتىلغان سۇ مەزمۇنى (Gw) نىڭ باشلىنىش ۋاقتى
2.3.6 HPMC قوشۇش ۋە ھاقارەتلەش ۋاقتى
2.4 باب خۇلاسە خۇلاسە
Chapter 3 Effects of HPMC addition on the structure and properties of wheat gluten protein under freezing conditions………………………………………………………………………………………...................24
3.1 تونۇشتۇرۇش ..................................................................................................................................................................................
3.2.1 Experimental materials ............................................................................................................25
3.2.2 Experimental apparatus ...........................................................................................................25
3.2.3 Experimental reagents…………………………………………………………………………. .................. 25
3.2.4 Experimental methods ....................................................................................................... 25
3. Results and Discussion ................................................................................................................ 29
3.3.1 The effect of HPMC addition and freezing time on the rheological properties of wet gluten mass………………………………………………………………………………………………………………………….29
3.3.2 توڭلاتقى بولىدىغان ئاۋاز بېرىش مەزمۇنى (CFW) نىڭ مىقدارى (CFW) نىڭ ساقلاش ۋاقتىنى (كەچكى) قوشقاندا ساقلاش ۋاقتىنىڭ ئۈنۈمى .................................................................wwuwurn.. 30
3.3.3 HPMC قوشۇلۇش نىسبىتى ۋە ھەقسىز سۇلفايدرىسنىڭ مەزمۇنى (C Beosel) بار. . 34
3.3.4 Effects of HPMC addition amount and freezing storage time on the transverse relaxation time (N) of wet gluten mass…………………………………………………………………………………35
HPMC بۇنىڭدىن MPMC بۇنىڭدىن كېيىنكى مىقداردىكى مىقداردا ۋە مۇزلىق ساقلاش ۋاقتى ھەققىدە ساقلاش ۋاقتى
3.3.6 FIPMC قوشۇلۇشى ۋە گللۇېن ئاقسىلىنىڭ يەر يۈزىدىكى گىرۋاپخانىسىنىڭ باھاسى
HPMC نىڭ باھاسى 3.3.7 ئىقتىدار ۋە گىلاسنىڭ مىكرو تور قۇرۇلمىسىنىڭ باھاسى ۋە مۇزاي يېتىش ۋاقتى ۋە مۇزلۇق ساقلاش ۋاقتى ۋە مۇزلۇق ساقلاش ۋاقتى
3.4 باب خۇلاسە خۇلاسە
4-باب HPMC نىڭ ستارخېن ساقلاش شارائىتىدىكى خان جەمەتى ۋە خۇسۇسىيىتىدە
4.1 Introduction .............................................................................................................................. . 44
4.2 Experimental materials and methods ................................................................................. 45
4.2.1 تەجرىبە ماتېرىياللىرى ..................................................................................................................................................................................................................................................................................................................................................................................................................
4.2.2 Experimental apparatus ............................................................................................................45
4.2.3 تەجرىبە ئۇسۇلى ....................................................................................................................................................................................................
4.3 Analysis and discussion ........................................................................................................... 48
4.3.1 بۇغداي چولپىنىنىڭ ئاساسىي زاپچاسلىرىنىڭ مەزمۇنى ........................................................................... 48
4.3.2 Effects of I-IPMC addition amount and frozen storage time on the gelatinization characteristics of wheat starch……………………………………………………………………………………………….48
4.3.3 Effects of HPMC addition and freezing storage time on the shear viscosity of starch paste………………………………………………………………………………………………………………………………………. 52
4.3.4 Effects of HPMC addition amount and frozen storage time on dynamic viscoelasticity of starch paste………………………………………………………………………………………………….55
4.3.5 Influence of HPMC addition amount and frozen storage time on starch swelling ability……………………………………………………………………………………………………………………………………….56
4.3.6 I-IPMC قوشۇلۇش مىقدارى . 57
4.3.7 HPMC قوشۇلۇش نىسبىتى ۋە مۇزلۇقنىڭ خەتىرىدىكى ساقلاش ۋاقتى
4.4 باپ خۇلاسە خۇلاسە 6 1
Chapter 5 Effects of HPMC addition on yeast survival rate and fermentation activity under frozen storage conditions………………………………………………………………………………………………. . 62
5.1Introduction .................................................................................................................................... 62
5.2 Materials and methods ............................................................................................................ 62
5.2.1 Experimental materials and instruments ............................................................................. 62
5.2.2 تەجرىبە ئۇسۇلى. . . . . ................................................................................................................... 63
5.3 Results and Discussion ............................................................................................................... 64
5.3.1 The effect of HPMC addition and freezing time on the proofing height of dough…………………………………………………………………………………………………………………………… 64
5.3.2 Effects of HPMC addition amount and freezing time on yeast survival rate…………………………………………………………………………………………………………………………………………65
5.3.3 ھاقارەتلەش ۋە توڭگۇزنىڭ مەزمۇنى ئۈچۈن HPMC ۋە توڭلىتىش ۋاقتى. »
5.4 باب خۇلاسە خۇلاسە 67
Chapter 6 Conclusions and Prospects ............................................................................................ ………68
6.1 Conclusion ................................................................................................................................. . 68
6.2 Outlook .......................................................................................................................................... 68
مىسال تىزىملىكى
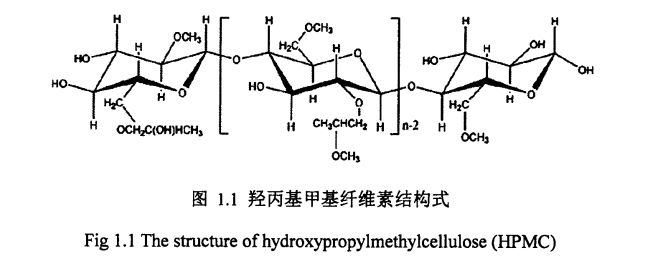
رەسىم 1.1 گىدروسسۋىلدېپىلنىڭ قۇرۇلمىلىق فورمۇللىكىنىڭ قۇرۇلما فورمىسى ................................ . 6
Figure 2.1 The effect of HPMC addition on the rheological properties of frozen dough…………………………………………………………………………………………………………………………………….. 15
رەسىم 2.2 نىڭ باھاسى
2.3-رەسىم HPMC قوشۇشنىڭ ئۈنۈمى ۋە ھاقارەتلەش ۋاقتى ۋە توڭلاتقۇ نۇرىنىڭ ئۈنۈمى,
2.4-رەسىم HPMC قوشۇش ۋە تولغان ناننىڭ ئېلخورتىيىتىنىڭ ئۈنۈمى ۋە مۇزدىن ئۆتۈش ۋاقتى . 20
Figure 3.1 The effect of HPMC addition and freezing time on the rheological properties of wet gluten…………………………………………………………………………………………………………………………. 30
1-رەسىم 3.2-رەسىمدىكى HPMC قوشۇش ۋە مۇزسىزلىق خۇسۇسىيىدىكى بۇغداينىڭ چېمپىيونلۇقىدىن توڭلىتىش ۋاقتى. . 34
بىر 3.3-رەسىمدىكى HPMC قوشۇش ۋە توڭگۇزنىڭ سۇلفايت نۇرىنىڭ مەزمۇنى بار. 35
رەسىمدىكى HPMC قوشۇلۇش مىقدارى ۋە مۇزسىز ئارام ئېلىش ۋاقتى (n)
EXT 3.5 بۇغداي گولۋىن گوللاندىيەلىك ئاقسىل ۋە ئىككىنچى تۇغۇندىي شەكىللىك
Figure 3.6 Illustration ................................................................................................................ ……….39
Figure 3.7 The effect of HPMC addition and freezing time on the microscopic gluten network structure…………………………………………………………………………………………………………... . 43
4.1-رەسىم 4.1 ستارەتسىز ھايۋاناتلاشتۇرۇش خاراكتېرلىك ئەگرى سىزىق ................................................................................... 51
Starch CareTe نىڭ 42-رەسىملىك قەبرە قەۋىتى. 52
Figure 4.3 Effects of adding amount of MC and freezing time on the viscoelasticity of starch paste……………………………………………………………………………………………………………………... . 57
Figure 4.4 The effect of HPMC addition and freezing storage time on starch swelling ability……………………………………………………………………………………………………………………………………... 59
چوڭلۇقتىكى HPMC قوشۇش ۋە مۇزلۇق ساقلاش ۋاقتىدىكى ساقلاش ۋاقتى . 59
رەسىم 1.6-رەسىم HPMC قوشۇش ۋە باشلىق ساقلاش ۋاقتى
Figure 5.1 The effect of HPMC addition and freezing time on the proofing height of dough…………………………………………………………………………………………………………………………………... 66
Figure 5.2 The effect of HPMC addition and freezing time on the yeast survival rate…………………………………………………………………………………………………………………………………... . 67
يېسىنچى (مىكروسكوپ تەكشۈرۈش) 5.3 مىكرو 10. 68
رەسىم 5.4-رەسىم HPMC قوشۇش ۋە مۇزسىزلىنىش ۋاقتى
جەدۋەل تىزىملىكى
Table 2.1 The basic ingredient content of wheat flour…………………………………………………. 11
جەدۋەل 2.2 I-IPMC نىڭ ئۈنۈمنىڭ ۋىللىس ئىدراكنىڭ ۋىلايىتىگە قوشۇلۇشنىڭ تەسىرى .................1
جەدۋەل 2. IPMC نىڭ I-IPMC نىڭ IPMC نىڭ راھەت خاسلىقىنىڭ تەسىرى ........................................14
جەدۋەل 2.4 IPPMC ھۆججىتىنىڭ i-ipmc ھۆججەتلىك ۋە توڭلىتىلغان سۇنىڭ (CF خىزمىتى)
جەدۋەل 2.0 ipmc ھۆججىتى ۋە تولغان بولكا خالتىسىدىكى تېز سۈرئەتلىك ۋاقىت ۋە مۇزلاش ۋاقتى ................................................................................................................................................................
جەدۋەل 3.1 گللۇېندىكى ئاساسىي تەركىبلەرنىڭ مەزمۇنى ..................................................................................2
جەدۋەل 3.2 IPMC قوشۇلۇشى I-IPMC قوشۇلۇشى ۋە توڭلاتقۇدا ساقلاش ۋاقتى (Yi IV) ۋە توڭلاتقۇنىڭ ساقلاش ۋاقتى ............................ 31
جەدۋەل 3. HPMC STILE نىڭ ئەڭ يۇقىرى تېمپېراتۇرا (مەھسۇلاتنىڭ تېمپېراتۇرىسى). 33
جەدۋەل 3.4 يۇيۇنۇپ بولغان ئىككىلەمچى قۇرۇلمىسى ۋە ئۇلارنىڭ تاپشۇرۇقىنى ۋە ئۇلارنىڭ تاپشۇرۇقلىرى .......... .37
جەدۋەل 3.5 نىڭ 3.5 خىل ئۈنۈمى ۋە بۇغداي يار موتۇnېنتى ئىككى چاقلىق شاھىتىنىڭ ئىككىلەمچى قۇرۇلمىسىدىكى توڭلىتىشنىڭ ئىككىلىنىشى. ................................................................. گىتىم) .40
جەدۋەل 3.6 I-IPMC قوشۇلۇشتىكى I-IPMC قوشۇش ۋاقتى, بۇغداي گلۇتسىكېننىڭ يەر يۈزىدىكى ئاسفوتوبىك ۋاقتى. 41
جەدۋەلنى بۇغداي چولپانلارنىڭ ئاساسىي زاپچاسلىرىنىڭ مەزمۇنى ...................................................................
Table 4.2 Effects of HPMC addition amount and frozen storage time on the gelatinization characteristics of wheat starch……………………………………………………………………………………………… 52
Table 4.3 Effects of I-IPMC addition and freezing time on the shear viscosity of wheat starch paste…………………………………………………………………………………………………………………………. 55
جەدۋەل 4.4 I-IPMC قوشۇلۇش نىسبىتى
1 - باب مۇقەددىمە
دۆلەت ئىچى ۋە سىرتىدىكى 1.1ReSearse تۇتقۇن ھالىتى
1.1.1-نومۇرلۇق نان
ھورلانغان نان تەكشۈرۈش ۋە ھوردىن چىققاندىن كېيىن خېمىردىن ياسالغان يېمەكلىكلەرنى كۆرسىتىدۇ. جۇڭگونىڭ ئەنئەنىۋى پارتلاش يېمەكلىكى سۈپىتىدە, ھور ناننىڭ ئۇزۇن تارىخى سۈپىتىدە بولۇپ, «شەرق نان» دەپ ئاتالغان. چۈنكى ئۇنىڭ تەييار مەھسۇلاتىدا دېڭىز سۈيى ياكى ئۇزۇنغا سوزۇلغان, تەمى يۇمشاق, تەمى يېمەكلىك, تەمى ۋە ئوزۇقلۇق ماددىلاردا مەرىمانە بار [L] غىدىقلاندۇرىدۇ [l] ئارىمىزدا كەڭ كۆلەمدە ئالقىشقا ئېرىشتى. بولۇپمۇ دۆلىتىمىزنىڭ ئاساسلىق يېمەكلىكى, بولۇپمۇ مىلتى. ئىستېمالچىلار شىمالدىكىدىكى مەھسۇلاتلارنىڭ يېمەك-ئىچمەك قۇرۇلمىسىنىڭ شىمالىي, جۇڭگودىكى ئۇن مەھسۇلاتلارنىڭ% 46 ace ace نىڭ% 48 ى.
1.1.2researchearche توپ مەيدانى
ھازىر, پارنى تاشلاش تەتقىقاتلىرى ئاساسلىقى تۆۋەندىكى تەرەپلەرگە كېلىدۇ:
1) يېڭى ئالاھىدىلىككە ئىگە ھورنى ئېچىش. پار ياراتقان نان خام ئەشيالىرى ۋە ئىقتىدار ئاكتىپ بولۇشتىن, ئىقتىدار ئاكتىپ تۈرلەرنىڭ ئىجازىشىدىن, پارگول-پارگانىيەتنىڭ يېڭىلىنىشى قۇرۇلدى, بۇ ئوزۇقلۇق ۋە ئىقتىدار بار. ئاساسلىق زاپچاس ئانالىزىنىڭ ئوخشىمىغان تەركىبىي قىسمىدىكى خۇسۇسىيەت پارچىسىنىڭ سۈپىتىنى باھالاش ئۆلچىمىنى قۇردى. Fu et a1. () 2015) يېمەك-ئىچمەك تەيبې ۋە پولىفېلوچىلارنى پارچىلاپ, بولاقنى پار ياسىغان بولكا ياساپ, نان تارقىتىلغان ناننىڭ ئوكسىد ناخشىسىنى باھالىدى. Hao & Bata (2012) Barley Blay ۋە زىغىرلىق (بىھۇدە ماددىلاردا مول مول ناننىڭ ئىشلەپچىقىرىلغانلىقى) Shiau et a1. .
2) بىر پىششىقلاپ ئىشلەش ۋە ئالاھىدە ئۇننىڭ ناننى پىششىقلاپ ئىشلەش ۋە بىرلەشتۈرۈشتىكى تەتقىقات. ئۇننىڭ جانلىق ماھىرىنىڭ ياكى يېڭى ئالاھىدە تەنھەرىكەتنىڭ تەسىرى ۋە يېڭى ئالاھىدە تەنھەرىكەتنىڭ تەسىرىگە ۋە يېڭى مەخلىق, يېڭى ئالاھىدە ئىنسا, ئۇن بىر پىششىقلاپ ئىشلەش شەكلىدە ئۇن ئالاھىدە ئىنچىكە ھالقىلارنى ئاساس قىلىپ, ئۇن بىر پىششىقلاپ ئىشلەش مودېلى قۇرۇلدى [7] قۇرۇلدى [7] قۇرۇلدى [7] قۇرۇلدى [7] بېكىتىلدى [7] قۇرۇلدى [7] قۇرۇلدى [7] قۇرۇلدى [7] بېكىتىلدى [7] قۇرۇلدى [7] بېكىتىلدى [7] قۇرۇلدى [7] قۇرۇلدى [7] قۇرۇلدى [7] قۇرۇلدى [7] قۇرۇلدى [7] قۇرۇلدى [7] قۇرۇلدى [7] قۇرۇلدى [7] قۇرۇلدى [7] قۇرۇلدى [7] قۇرۇلدى [7] قۇرۇلدى [7] قۇرۇلدى [7] قۇرۇلدى [7] قۇرۇلدى [7] قۇرۇلدى [7] مەسىلەن, ئوخشىمىغان نۇرغۇن ئايراق بولغان گۈلنى ھەددىدانلىق ئۇسۇلىنىڭ سۈپىتى ۋە ھورنى ھورنىڭ سۈپىتىدىكى تەسىرلەر [7] 81; ھوردا بىر نەچچە موم دانىخورەكنىڭ بىرىكمىسىنىڭ بىرىكمىنىڭ تەسىرى [9j قاتارلىقلار. جۇ, خۇاڭ, & خان (2001) بۇغدات رولنىڭ سۈپىتى خېھ بۇغداي خالتىنىڭ سۈپىتى بىلەن يۈز بەرگەن نان ۋە ھوران نانلىرى بىلەن كۆرۈنەرلىك ئەمەس دەپ قارىدى. جاڭ, EST A1. (2007) يېپاتىلگەن ئاقسىل كاشىلى, ئاقسىل تىت-خەلكەندە ئۇ باغلىنىپ, MLOCITHEAL WINDATRIVE, HMW) ۋە ئومۇمىي ئاقسىل مەزمۇنلىرىنىڭ شىمالىنىڭ ساپور سۈپىتى بىلەن مۇناسىۋەتلىك. كۆرۈنەرلىك تەسىر كۆرسىتىڭلار [11].
3) خېمىر تەييارلاش ۋە ھوردىن ياسالغان نان ياساش تەتقىقات. ئۇنىڭ سۈپىتى ۋە جەرياندا ئېتىبار باھادا پارتلانغانلىق ئىشلەپچىقىرىش جەريانىنىڭ تەسىرىدە تەتقىقات Liu changhong et. (2009) خېمىر كېسەل باسقۇچىدا مۇنداق كۆرسىتىلدى, سۇ قوشۇلغانسى, سۇدىن دەكرى كۆپ قېتىم ئۇتتۇرۇڭ, ئولتۇرۇش ۋاقتى تۇرغۇچى ۋە قىلتاق ئۇنىڭ سەزگۈنى باھالاشتا كۆرۈنەرلىك تەسىر كۆرسىتىدۇ. ئەگەر بۇ جەريان شارائىت ماس كەلمىسە, مەھسۇلاتنىڭ كۆك, قېنىق ياكى سېرىق رەڭنى كەلتۈرۈپ چىقىرىدۇ. تەتقىقات نەتىجىسىدە SouG بېرىلگەن سۇنىڭ مىقدارى% 45 كە يەتتى, ئورۇللاش ۋاقتى 5 مىنۇت, دەل-ئاينىڭ بوغۇلۇش نىسبىتى 6.5,000 ئىدى, ئاق ۋە سەھرانىڭ ئاق بىرىكمىلەر بىلەن تەمىنلەنگەن. خېمىر خېمىرنى كۆنگەندە بىرلا ۋاقىتتا ئۆرۈلۈپ چۈشغاندا, خېمىرنىڭ ئۇ قورۇمىسى, سىلىق, ئېلاستىي ۋە پارقىراق يەر; دومىلىما نىسبەت 3: 1: 1, خېمىر ۋاراق پارقىراق, ھور ناننىڭ ئاق تەنقىدىيلىكى [l to; لى, et A1. (2015-يىلى) Compound Remouded hought ۋە ئۇنىڭ پاردى تەرەپتىكى پروگراممىنىڭ ئىشلەپچىقىرىش جەريانىنىڭ ئىشلەپچىقىرىش جەريانىنى تەكشۈرۈڭ [13].
4) ھوردىن ياسالغان ناننى ياخشىلاشتىكى تەتقىقات. ناشتىلىق ھور سۈپىتىنىڭ قوشۇلۇشى توغرىسىدىكى تەتقىقات ۋە قوللىنىلىدۇ ئاساسلىقى خرۇسغاتلارغا (مەسىلەن, بىر قەدەر خۇلەزم, تەقلىد قىلىش قاتارلىقلارنى ئۆز ئىچىگە ئالغانلار [15] مۇناسىپ بۇ جەريانغا ئوخشاش, تەخمىنەن لايىھىلەش) ۋە باشقا لايىھىلەش ۋە باشقا چىقىم خاراكتېرلىك ئاقسىل ۋە باشقا تۈرلەرنى ئىشلىتىش ئارقىلىق ئوتتۇرىغا قويۇلغان. سېلېك كېسەللىكلىرى (سېلېكك كېسەللىكىدىكى بىمارلارنىڭ يېمەك-ئىچمەك ئېھتىياجى [16.1 CIT.
5) پاراكەندىچىلىك ۋە مۇناسىۋەتلىك نان ۋە مۇناسىۋەتلىك مېخانىزملارغا قارشى تۇرۇش. Pan lijun et al. (2010) بىرىكمە كۆرۈنەكنى تەجرىبە خاراكتېرلىك لايىھىلەش ئارقىلىق ياخشى بولغان ئۈنۈمىگە ئېرىشىش ئارقىلىق [L ئۇنداق ئەمەس. ۋاڭ, كۇنۇپكىلار. () 2015 گولتېر ئاقسىلنىڭ ئامالسىز دەرىجىدىكى نەيمىيلىك ئۇنۋانىغا ئۇچرىغان نەيمىيلىك ئۇنۋانىغا ئۇچرىغان نەيرىلىك ئۇنۋاننىڭ تەسىرىنى تەتقىق قىلغان. نەتىجىدە بۇ سۇ يوقىتىپ قويغان ۋە كلاسسىك يىغىلىش نان ياساشنىڭ ئاساسلىق سەۋەبلىرى بولۇپ, 20].
6) يېڭى فېرمېنتلىق ۋە سورۇنجۇنىڭ ئىلتىماسى. جياڭ, et A1. (2010) Wetomanium sp نى ئىشلىتىش. ھور (گومراخۋانى) پارتارلانغان نانلارنى پارتلاش ئۈچۈن XylLaast (Grustometable بولكىسى بىلەن) ھاسىل قىلدى Gerez, et A1. (2012) ۋېرمېنتلىق ئۇن مەھسۇلاتلىرىدا ئىككى خىل ئۇزۇنلۇق لاپتىكى موتاي باكتېرىنى ئىشلەتتى ۋە سۈپىتىنى يۇقىرى كۆتۈردى [221; Wu, el. (2012) ھەر خىل قىستۇرما كىلاسسىك باكتېرىيە سەھىپىسىنىڭ تەسىرى (لاكتىن كۆچكامىن, لاكتىن پائالىيىتى, لاكتىن پائالىيىتى نانقىسى, ئۇزۇن پاكارۇسېللىق نۇقتا) نىڭ سۈپىتى (كونكرېتلىق ۋە تارىخى, ئىپادىسى) نىڭ سۈپىتى (كونكرېت ھەجىمى) and Gerez, et A1. (2012) لى نەقىش كىسلاتاسى كىسلاتاسىنىڭ ئالاھىدىلىكى ئالاھىدىلىكىنى ئىشلىتىپ, ئۆسۈملۈك مەھسۇلاتلىرىنىڭ تازىلىق ئالاھىدىلىكىنى تېزلىتىپ, پادى ۋە باشقا تەرەپلەرنىڭ توپلاش ئوبنىكىنى تېزلىلەندۈردى.
7) توڭلىتىلغان بولكىنىڭ توڭلىتىلغان داغنىڭ قوللىنىلىشى توغرىسىدىكى تەتقىقات.
بۇنىڭ ئىچىدە پارنى تاش نان ئادەتتە ئادەتتىكى ساقلاش شارائىتىنىڭ تەركىبىدە قېرىندىشىچە, ئۇ بولۇشى كېرەك, بۇ بىر مۇھىم ئايفون ئىشلەپچىقىرىش ۋە بىر تەرەپ قىلىشنى چەكلەش مۇھىم ئامىل. ئابىدە, ھورلانغان بولكىنىڭ سۈپىتى تۆۋەنتۈرۈلگەندىن كېيىن - توسىقى قۇرغۇرۇش, قەبرىستانلىقنىڭ سۈپىتىگە, قەبرىستانلىق ۋە ساز-شارى ۋە سابىق بولۇش نىسبىمۇ ئۆرلەش, ھەزىم قىلىش ۋە سۈمۈرۈلۈش ۋە سۈمۈرۈلۈش نىسبىتى تۆۋەنلەيدۇ, ئوزۇقلۇق قىممىتى تۆۋەنلەيدۇ, ئوزۇقلۇق قىممىتى تۆۋەنلەيدۇ, ئوزۇقلۇق قىممىتى تۆۋەنلەيدۇ, ئوزۇقلۇق قىممىتى تۆۋەنلەيدۇ, ئوزۇقلۇق قىممىتى تۆۋەنلەيدۇ, ئوزۇقلۇق قىممىتى تۆۋەنلەيدۇ, ئوزۇقلۇق قىممىتى تۆۋەنلەيدۇ, ئوزۇقلۇق قىممىتى تۆۋەنلەيدۇ. بۇ ئۇنىڭ Charf ھاياتىغا تەسىر كۆرسىتىدۇ, ئەمما يەنە نۇرغۇن ئىسراپچىلىق پەيدا قىلىدۇ. ئىستاتىستىكىغا قارىغاندا, قېرىش سەۋەبىدىن يىللىق زىيان تېخىمۇ كۆپ زىياننىڭ سانىنىڭ% 3 ى بار. 7%. كىشىلەرنىڭ تۇرمۇش سەۋىيىسىنىڭ ئۆسۈشى ۋە يېمەكلىك سانائىتىنىڭ تېز تەرەققىي قىلىشى ۋە ئۆسۈۋاتقان مۇھىم تەرەققىيات مەھسۇلاتلىرىغا, ئۇزۇن ساقلاش ھاياتتىن يۇقىرى سانائەت, ئۇزۇن ساقلاش ھاياتقا قانداق يەتكۈزگەندە, شۇندىلا شۇنچە ئۇزۇن ھالەتتىكى تېخنىكا مەسىلىسى ۋە ئاسان داۋاملىق تېجەشلىك. بۇ ئارقا كۆرۈنگۈدەك, توڭلىتىلغان خېمىرۇلۇمغا ئاساسلاندى, شۇنداقلا تەرەققىياتى يەنىلا شۇنداق كۆتۈرۈلۈپ كەلدى.
1.1.3.330 توڭلىتىلغان خېمىر
توڭلىتىلغان خېۋى تەرىپىدىن 1950-يىللاردا تەرەققىي قىلغان ئۇن مەھسۇلاتلىرى ئىشلەپچىقىرىش ۋە ئىشلەپچىقىرىشنىڭ يېڭى تېخنىكىسى. ئۇ ئاساسلىقى بۇغداي ئۇننىڭ ئاساسلىق AW ماتېرىيالى ۋە سۇ ياكى شېكەر سۈپىتىدە ئاساسلىق ياردەمچى ماتېرىيال سۈپىتىدە ئىشلىتىشنى كۆرسىتىدۇ. قاپلانغان, قاچىلانغان ياكى ئورالغان, باشقا تەرەپلەر مەھسۇلاتنى مۇزلاپ كەتكەن ياكى توڭلىتىش ئۈچۈن, كېرەكلىك مەھسۇلاتلارغا نىسبەتەن كېرەكلىك, دەلىل-ئۇچرىغان مەھسۇلاتلارنى 251] يېتىدىكەن.
ئىشلەپچىقىرىش مۇساپىسىگە ئاساسەن, توڭلىتىلغان خېيىقەسكە ئاساسەن تۆت خىل ھالەتكە بۆلۈنۈشكە بولىدۇ.
جاۋاب) توڭلىتىلغان خېمىر ئۇسۇلى: خېمىر بىر پارچە پارچىلىنىپ, توڭلىتىلغان, توڭلىتىلغان, ئەۋەتىلگەن, ئىسپاتلانغان ۋە پىشۇرۇلغان ۋە پىشۇرۇلغان (پىشۇرۇش قاتارلىقلار)
B) جۇنتىغا بۇرۇنقى ۋە يېقىشلىق ئۇسۇلىنى بىر تەرەپتە: خېمى ئېلان قىلىنغان, بىرى تېز توڭلىتىلغان, بىرى توڭلىتىلغان, بىرى ئىسپاتلانغان, بىرى ئىسپاتلانغان, بىرى پىشۇرۇلغان (پىشۇرۇش قاتارلىقلار)
c) ئالدىن پىشۇرۇلغان خېمىر خېمىر: خېزى بىر پارتلاش قىلىپ قاتلانغان, خېلى (مەلۇم دەرىجىدە پىشۇرۇلغان.
D) تولۇق بىر تەرەپ قىلىنغان خېمىر: خېزى بىر پارتلاش ۋە شەكىللەنگەن بولۇپ, بولۇپمۇ تەكشۈرۈپ, تولۇق دەلىللىدى, ئاندىن تولۇقمۇ پىشۇرۇلغان, ئەمما توڭلىتىلغان, توڭلىتىلغان, توڭلىتىلغان, توڭلىتىلغان, توڭلىتىلغان, توڭلىتىلغان, توڭلىتىلغان, توڭلىتىلغان, توڭلىتىلغان, توڭلىتىلغان, توڭلىتىلغان, توڭلىتىلغان.
توڭلىتىلغان خېمىرنىڭ بارلىققا كېلىشى, قېلىپلاش سېيىش, قېلىپلاشقان پانانى مەھسۇلاتلىرىنى ئۈنۈملۈك تۆۋەنلىتىدۇ, ئىشلەپچىقىرىش ئۈنۈمىنى ئۈنۈملۈك ھەل قىلالايدۇ, ئىشلەپچىقىرىش ئۈنۈمىنى ئاشۇرۇش ۋە ئەمگەك كۈچىنى ئۆستۈرەلەيدۇ. شۇڭلاشقا, ستار يېمەكلىكلەرنىڭ ياشانغان ھادىسىسىنى ئۈنۈملۈك چەكلەيدۇ, مەھسۇلاتنىڭ قويۇق تۇرمۇشىنى كېڭەيتىشنىڭ تەسىرى. شۇڭلاشقا, بولۇپمۇ ياۋروپا, ئامېرىكا ۋە باشقا دۆلەتلەر ۋە چاققانلىق تاتلىق نان (توڭلۈكى), بولكا ئۆرۈلۈپ, نان (قولۇڭ), فىرانسۇزچە سومكا, FORK), POLD), POLD), POLD), POLD), ساقلانما
تورتلار ۋە باشقا پالۋان مەھسۇلاتلىرىنىڭ ئوخشىمىغان ئۇنۋانلىرى بار [26-27]. تولۇق بولمىغان ستاتىستىكا بويىچە, 1990-يىلغا بارغاندا, ئامېرىكىدىكى كېمەنىڭ% 80 ى توڭلىتىلغان خېخىدىن ئىشلىتىلگەن. ياپونىيىدىكى% 50 كاۋىپى يەنە توڭلىتىلغان خېمىرنى ئىشلەتكەن. 20-ئەسىر
ئالدىنقى ئەسىرنىڭ 90-يىللىرىدا, توڭلىتىلغان خېمىر پىششىقلاپ ئىشلەش تېخنىكىسى ئوتتۇرىغا قويۇلدى. پەن-تېخنىكانىڭ ئۈزلۈكسىز تەرەققىي قىلىشى ۋە كىشىلەرنىڭ تۇرمۇش سەۋىيىسىنى ئۈزلۈكسىز مۇكەممەللەشتۈرۈپ, فىلاڭ مەيدانىنىڭ جاھىللىق دەرىجىسىنىڭ كەڭ تەرەققىيات ئىستىقبول ۋە غايەت زور تەرەققىيات بوشلۇقى بار كەڭ كۆلەمدە تەرەققىيات مەيدانلىرى بار
توڭلىتىلغان خېمىرنىڭ 1.1.4-پاراكەندىسى ۋە خىرىس
توڭلىتىلغان خېمىر تېخنىكىسى شۈبھىسىزكى ئەنئەنىۋى كىشىلەرنىڭ ئەنئەنىۋى جۇڭگونىڭ سانائەتلەشتۈرۈش ئىشلەپچىقىرىش ناھايىتى مۇمكىن. قانداقلا بولمىسۇن, بۇ بىر تەرەپ قىلىش تېخنىكىسى يەنىلا بەزى قىستۇرمىلاردا يەنە بەزى قىستۇرمىلار بار, بولۇپمۇ بارلىق بوشلۇق, كونكرېت ئىمارەت, مۇۋاپىق ئاۋاز, سۇ يوقىتىش, ناچار تەمى, تەمىنى قوبۇل قىلىش, تەمكىنلىك, تەمىنى قوبۇل قىلىش, تەمكىنلىك ۋە سۈپەتسىزلىكىنى دەلىللەيدۇ. ئۇنىڭدىن باشقا, توڭلىتىش سەۋەبىدىن
خېزى توپ (نۇرى, ئاقسىل, كەرشا, مىكرو, سۇلۇق بەلگە تارتىش كۈچى), كۆپ خىل ئارخىپ كۆرۈنمە يۈزى), كۆپ خىل ئارخىپ كۆرۈنكىلى) يۇمشاق دېتال سىستېمىسى 1281.
كۆپىنچە تەتقىقاتلاردا بايقىلىشىچە, مۇزرايىنىڭ شەكىللەندۈرۈش ۋە مۇزلۇق يېمەكلىكلەرنىڭ شەكىللىنىش ۋە ئېشىشىنى كەچۈرۈم قىلغانلىقى بايقالغان مەھسۇلات سۈپىتىنىڭ ناچارلىشىشىغا ئىنتايىن مۇھىم ئامىللار [291]. مۇز خرۇستاللىرى پەقەت يېگانە ساندۇقنىڭ ھايات قېلىش نىسبىتىنى تۆۋەنلىتىدۇ, ئەمما Starge StargellinitYmetinitymallinitYment ۋە Gelit Slocells غا تەسىر كۆرسىتىپ, يېتىلىش ھۈجەيرىلىرىگە تەسىر كۆرسىتىدۇ, يېتىلىش ھۈجەيرىلىرىگە تەسىر كۆرسىتىدۇ, بۇ كلايتۇرا ئەخلەتلەرنى ئازايتىش ۋە تارقىتىش. ئۇنىڭدىن باشقا, توڭلىتىلغان ھالەتتە, بازارنىڭ داۋالغۇش مۇز كىرىستاللىرىنىڭ ترۇستاللىشى سەۋەبىدىن مۇز كىرىستالنى كەلتۈرۈپ چىقىرىدۇ [30]. شۇڭلاشقا, خلانېتىسى ۋە Starch نىڭ پايدىسىز تەسىرى قانداق قىلىپ يۇقارقى مەسىلىلەرنى ھەل قىلىشنىڭ مۇھىملاس كېلىدىغان مەسىلە, ئۇ يەنە قىزىق تەتقىقات مەيدانى ۋە يۆنىلىشىمۇ بار. ئۆتكەن ئون يىلدا, نۇرغۇنلىغان تەتقىقاتچىلار بۇ ئەسەر بىلەن شۇغۇللىنىپ, بىر ئاز مول تەتقىقات نەتىجىسىنى قولغا كەلتۈردى. قانداقلا بولمىسۇن, بۇ ساھەدە يەنىلا ئۈزۈلۈپ قارىمىغان, بىر قىسىم ئومۇملاشقان ۋە تالاش-تارتىش بار مەسىلىلەر: بۇنىڭغا ئوخشاش, مەسىلەن:
بىر) توڭلىتىلغان جانلىقنىڭ سۈپەتنىڭ سۈپەتلىكىنى قانداق چەكلەشنى قانداق چەكلەش, بولۇپمۇ بىر مەسىلە خېمىر, يېكچ, يېزاغ ۋە ئېچىلىشتىكى ئۈچ چوڭ زاپچاسنىڭ قۇرۇلۇشى ۋە خۇراقلىشىشى كېرەك. بۇ تەتقىقات ساھەسىدىكى قىزىق نۇقتىلار ۋە نېگىزلىك مەسىلىلەر
B) چۈنكى ئوخشىمىغان تىپتىكى ئۇن مەھسۇلاتلىرى ۋە ئوخشىمىغان مەھسۇلات مەھسۇلاتلىرىدىكى پەرقلەر بىلەن پەرقلىق ئەھمىيەتكە ئىگە بولغان, يەنىلا ئالاھىدە مەھسۇلات تىپلىرىنى بىرلەشتۈرۈشتە ئالاھىدە تەتقىقاتنىڭ تەرەققىياتىغا مۇقەپشە مۇنداق دېدى:
C) يېڭى توڭلىتىنى كېڭەيتىش, يەنى يېڭى توڭلىتىلغان خېمىر سۈپىتىنى ئاشۇرىدۇ, بۇ ئىشلەپچىقىرىش كارخانىلىرىنى ئەلالاشتۇرۇش ۋە مەھسۇلات تىپىنىڭ يېڭىلىنىشى ۋە ئىشلەپچىقىرىشتا يېڭىلىنىشى بىلەن پايدىلىق. ھازىردا يەنىلا تېخىمۇ كۈچلۈك بولۇشى ۋە كېڭەيتىش كېرەك.
D) گىدرولوگېننىڭ توڭلىتىلغان خېمىر مەھسۇلاتلىرىنىڭ سۈپىتىنىڭ سۈپىتى ۋە مۇناسىۋەتلىك مېخانىزملىرى يەنىلا داۋاملىق تەتقىق قىلىشقا ۋە سىستېمىلىق چۈشەنچە كېرەك.
توڭلىتىلغان خېمىرنىڭ 1.1.5researse بالدىس ئورنى
توڭلىتىلغان خېمىرنى كۆزدە تۇتۇپ, توڭلىتىلغان بىر يۆتەل تېخنىكىسىنىڭ يۇقارقى مەسىلىلەرنى ساقلاش ۋە ياخشىلىنىشى, توڭلىتىلغان خېمىردىكى مەھسۇلاتلارنى ياخشىلاش تەتقىقاتى ۋە باشلانغان ھەرىكەتلەر رايونىنىڭ قۇرۇلمىسى ۋە خالايىسىدىكى ئۆزگىرىش مېخانىزىمىدىكى ئۆزگىرىشلەرنى كۈچەيتىدۇ ۋە باشتېما خاراكتېرلىك تەتقىقاتتىكى بىر مەسىلە. كونكېرت جەھەتتىن ئېيتقاندا, يېقىنقى يىللاردىكى ئاساسلىق دۆلەت ئىچى ۋە سىرتىدىكى ئامېرىكا تۆۋەندىكى نۇقتىلارغا ئەھمىيەت بېرىدۇ:
I. پارتلاشنىڭ قۇرۇلۇشى ئەندىشىسىنىڭ ئۆزگىرىشىدە, بىئولوگىيىلىك ماكرومولوكويىسىنىڭ قۇرۇلمىسى بار, توڭلىتىلغان ساقلاش ۋاقتىنى (ئاقسىل, كراخكا قاتارلىقلارنىڭ ئۆزگىرىشى) مەسىلەن, مۇز كىرىستال دېگۈدەك كېڭەيتىلىدۇ. ئوتتۇراھال ۋە ئېشىش ۋە ئۇنىڭ سۇ دۆلەت ۋە تارقىتىش مۇناسىۋىتى; بۇغداي گل ئېتېن ئاقسىل قۇرۇلمى قۇرۇلمىسىنىڭ ئۆزگىرىشى ۋە مال-مۈلۈكلىرى ئۆزگىرىدۇ [31] STARCH قۇرۇلمىسى ۋە مۈلۈكنىڭ ئۆزگىرىشى مەتبەئە مىكرو تازىلىق ۋە مۇناسىۋەتلىك خۇسۇسىيەتتە ئۆزگىرىش 361.
تەتقىقاتتا كۆرسىتىلىشىچە, توڭلىتىلغان بىر تەرەپ قىلىش خۇسۇسىيىتى: 1 بولسا (1) توڭلىتىش جەريانىنى پەسەيتىشنىڭ ئاساسلىق سەۋەبىلىرى: يېقىشلىق ياشاشنى, ئۇنىڭ ئېچىلىش مۇراسىتى ۋە ئۇنىڭ كۈتۈنۈش پائالىيىتى كۆرۈنەرلىك تۆۋەنلىدى. 2) خېمىرنىڭ ئۈزلۈكسىز ۋە تولۇق تور قۇرۇلمىسى ۋەيران بولۇپ, خېمىرنىڭ ھاۋا تۇتۇلۇشىنىڭ ئالدىنى ئالىدۇ. قۇرۇلما كۈچى زور دەرىجىدە تۆۋەنلىتىلىدۇ.
II. توڭلىتىلغان خېمۇل سۇيۇق ئىشلەپچىقىرىش جەريانىنى ئەلالاشتۇرۇش, توڭلىتىش شارائىتى ۋە فورمۇلا. توڭلىتىلغان خېمۇ توڭ, تېمپېراتۇرا كونترول قىلىش, قوغداش شەرتى, توڭلىتىش نىسبىتى, Muluten ئاقسىلنىڭ مەزمۇسى ۋە ئېرىتىش ئۇسۇللىرىنىڭ ھەممىسى توڭلىتىلغان خېمىرغا تەسىر كۆرسىتىدۇ [7]. ئومۇمەن قىلىپ, چوڭلۇقى تېخىمۇ كۆپ تارقىلىپ, تېخىمۇ كۆپ مۇز ئۈزۈلمە ئەرزان باھالىق سوممى ھاسىل قىلىدۇ, تۆۋەن توڭلىتىش نىسبىمۇ توڭلىتىش نىسبىمۇ ئۇزۇن مۇددەتلىك تارقىتىلمايدىغان چوڭ مۇز كىرىستال ئىشلەپچىقىرىدۇ. ئۇنىڭدىن باشقا, ئۈزلۈكسىز پەسىل خاراكتېرلىك تېمپېراتۇرىدا تۆۋەن دەرىجىدىكى تېمپېراتۇرا (CTA) (CTA) نى ئىشلەپچىقىرىپ, تەننەرخى يۇقىرى, ئەمما چىقىمى, ئەمەلىي ئىشلەپچىقىرىش ۋە سوغۇق زەنجىرسىمان تىرانسپورتى ئادەتتە كىچىك. بۇنىڭدىن باشقا, توڭلىتىش تېمپتىنىڭ ئەۋرىشىملىكىنىڭ داۋالىنىشى تۈنتالشېل دېزىنقا كەلتۈرۈپ چىقىرىدۇ, بۇ خېمىنىڭ سۈپىتىگە تەسىر كۆرسىتىدۇ.
III. خۇرۇچ ئىشلىتىش ئۈچۈن خۇرۇچ ئىشلىتىش ئۈچۈن توڭلىتىلغان خېمىرنىڭ سۈپىتىنى يۇقىرى كۆتۈرۈش. مەسىلەن, توڭلىتىلغان ھەرىكەتنىڭ ئوخشىمىغان نۇقتىسىنىڭ سۈپىتىنى يۇقىرى كۆتۈرۈش ئۈچۈن, نۇرغۇن تەتقىقاتچىلار ئاساسلىقى تۆۋەندىكى نىسبەت, I) پىشجامىدىن پىششىقلاپ ئىشلەش, مەسىلەن, دېگەندەك Amylase; II) Monoglycerite Steage, چېسلا, SSL, CSL, چېسلا قاتارلىق پىچاق. III) Antixididans, Ascorbic كىسلاتاسى قاتارلىقلار. % IV) Polysacchralide سۇdroclows, مەسىلەن گۇيار سېغىز, مەسىلەن گابىر سېمبۇم, كونجاكېرلىق, رونيۇجاكې بازىرىغا ئوخشاش, ناتيزاك بورىنى قاتارلىقلارغا ئوخشاش. V) شۈ, & A1 قاتارلىق ئىقتىدار ماددىلىرى. (2009) مۇز-يۇلتۇزلارنى توپادىن قويۇۋەتكەن ئاقسىلنى قوشتى ۋە ھۆل گلۇتېن ماسقىنى قوشۇپ, خلان بەش ئاقسىل ۋە ئىقتىدارنىڭ قۇرۇلمىسى ۋە ئىقتىدارىنى تەتقىق قىلدى ۋە تەتقىق قىلىنىدىغانلىقىنى ئېيتتى.
Ⅳ. AntiFree نى ھەشەمەتلىك ۋە يېڭى سېلىك يۇڭ ھەۋەسكارلىرىنى بېقىش [58-59]. SaSano, et A1. (2013-يىلى) ئارىلاشما دېڭىز قىرغىقىلىق يېقىملىق يېقىملىق يېقىملىق مۇسابىقىسى ۋە S12I, Yu, Yu.
1.1.6 توڭلىتىلغان خېمىر سۈپەتنى ياخشىلاشتا
سۇdrocolhone نىڭ خىمىيىلىك خاراكتېرى (گلۇكوزا, رەجۇق, خىمىيىلىك, خىيانەت, ئىنسانلار, مانوۋوس قاتارلىقلار) دىن تەركىب تاپقان كۆپ قۇتۇپلۇق خاراكتېرى 0 [ 1-4. Glycosidic Bond ياكى / and a. 1 - "6. Glycosidic Bond ياكى B. 1-4. تېرىش ئۆسۈملۈك بورۋاكېر بورى, گۈن گوم, گۈن گوم كوماندىسى, مەسىلەن شىتاخاندا سېغىز. يېمەكلىك سىستېمىسىدىكى سۇ ئىشلىتىش, دۆلەت ۋە تارقىتىش يېمەكلىكلىرى كۆپ ئىقتىدارلىق, سۇ - ئوكېركسوردۋانلىقنىڭ كەڭلىكى ۋە سۇ - ئوكۇل چېچىلىپ كېتىش ۋە سۇ چىقىرىش ئىقتىدارى ئىنتايىن ماس كېلىدۇ. شۇنىڭ بىلەن بىر ۋاقىتتا ئېگىزلىك, مۇقىملاشتۇرۇش ۋە سۇنىڭ ئۆزلىرى بىلەن زىچ مۇناسىۋەتلىك ئۇن مەھسۇلاتلىرىنىڭ يېمەكلىك پىششىقلاپ ئىشلەشنى ئۆز ئىچىگە ئالىدۇ. ۋاڭ شىنت al. (2007) ئورتاق پوستىدىكى پولىسالرىرورتۇرى ۋە ياتاقلىرىنىڭ ئەينەك ئۆتۈش تېمپېراتۇرىسىنى تەتقىق قىلىش نەتىجىسى [631. ۋاڭ يىشۇڭ قاتارلىقلار. (2013) ھەر خىل گىدروفىل تىلى كولولىدىن تەركىب تاپقان خېمىرنىڭ ئېقىشىنى كۆرۈنەرلىك ئۆزگەرتەلەيدۇ. خۇسۇسىيەتنى ئۆزگەرتىپ, خېمىلنىڭ تەرەققىياتىنى ياخشىلاپ, خېمىرنىڭ ئېفىقلىنىشىنىڭ ۋەيۋىسىنىڭ ئېساچانلىقنى ئاشۇرۇش, ئەمما خېمىرنىڭ دۇنيانى قىسقارتىڭ [ئۆچۈرۈش.
1.1.7 FIANDROXINGPREPPYL MEETLEL STOULOSE (HydroxyPripyl methyl mythyl metuulos, i-ipmc)
Hydroypropyl Methyl Metululse (Hydroyyp Bellulpyl MydroyLspyl ۋە Mypmc) شېئىرىلنىڭ ھۈجەيرىسىنى قىسمەن پەيدا قىلىدۇ. ئامېرىكا بانكىسى
تىمىچى مولېكۇلا زايومى ۋە كىرىستال زايومىدىكى ھىمروگېن زايومى سەۋەبىدىن, Calululose نىڭ ئىلتىماسىنىڭ كەمچىللىقىنى چەكلەيدۇ. قانداقلا بولمىسۇن, HPMC نىڭ يان سوسى پەسلىدىكى ئورۇنلاشتۇرۇشنىڭ بولۇشى يوپۇرماقلىق ھارامچا زايوكىنىڭ ئارىسىدا, ئۇنى تېخىمۇ گىدروفىل كىچىك قىلدى. سېلائىلنى قۇلايدىكى بارلىق گىدروفىللىق بولۇپمۇ ئۇنىڭ ئۆزگىچە ئەسلىگە كەلتۈرگىلى بولىدىغان تېنچېمو-مايلىق خاسسىقى سەۋەبىدىن, HPMC ھەمىشە كونترول قىلىنىپ كەتكەن زەھەرلىك چېكىملىكنىڭ كاپسۇل زاپچاسلىرى سۈپىتىدە ئىشلىتىلىدۇ. يېمەكلىكلەردە, HPMC يەنە ساۋاقەت, ئېغىلارغۇچىلار, ئېلاۋۇلكۇس قاتارلىقلارمۇ ئىشلىتىلىدۇ ۋە مۇناسىۋەتلىك مەھسۇلاتلارنىڭ سۈپىتىنى ئۆستۈرۈپ, كونكرېت مەھسۇلاتلارنى ئۆستۈرىۋاتقاندەك ئوينىماقتا. مەسىلەن, HPMC باشقا HTCMC نىڭ جەڭچىلەشتۈرۈش ئالاھىدىلىكىنى ئۆزگەرتىپ, كراھىنىڭ يېقىلغۇ كۈچىنى ئازايتالايدۇ. , HPMC ئاۋازدىكى نەملىكلەرنىڭ زىيىنىنى ئازايتالايدۇ, بول, بولنىڭ قاتتىقلىقىنى قىسقارتالايدۇ ۋە بولاقنىڭ قېرىپ كېتىشىدىن ئۈنۈملۈك چەكلەيدۇ.
گەرچە HPMC تەرىپىدىن مەلۇم دەرىجىدە ئوچۇق خېرىدار ۋە بولكاغا قارشى تۇرۇش ۋاكالەتچىسى ۋە بولكا قاتارلىقلار قىلىپ ئىشلىتىلىدۇ,, ئىشلەپچىقىرىش خاسلىقىنى, ئىشلەپچىقىرىش خاسلىقىنى, چوڭ تىپتىكى ئىشخانا ۋە ئۇزۇندىن قالالايدۇ. Dear Gum, كاناان گوم قاتارلىق جىنىسلىق كوللودقا سېلىشتۇردى, پۇڭەك ۋە توڭلىمە ۋە توڭلىتىلغان HPIC نىڭ قوللىنىشچانلىرى خېمىرتۇرۇچنىڭ قوللىنىشچانلىرى توڭلىتىلغان بولسۇن ئۇنىڭ ئۈنۈمىگە مۇناسىۋەتلىك مۇناسىۋەتلىك دوكلاتلارنىڭ كەملىكى بار.
1.2ReSearch مەقسىتى ۋە ئەھمىيىتى
ھازىر, باشتىن كەچۈرگەن توڭلىتىنى بىر تەرەپ قىلىش تېخنىكىسى ھازىرلىنىۋاتقان تېخنىكىنىڭ قوللىنىشچانلىقى ۋە چوڭ ئىشلەپچىقىرىش يەنىلا تەرەققىيات باسقۇچىدا. شۇنىڭ بىلەن بىر ۋاقىتتا, مۇزلاپ كەتكەن خېمىرنىڭ ئۆزىدە بەزى كەمتۈكلۈك ۋە كەمتۈكلەر بار. بۇ ئۇنىۋېرسال ئامىللار شۈبھىسىزكى ھەر توڭلىتىلغان خېمىرنى ئىلگىرى سۈرۈشنى چەكلەڭ. يەنە بىر تەرەپتىن, بۇ ئىككى توڭلىتىلغان خېڭنىڭ قوللىنىشچانلىقىنىڭ ياخشى ۋە كەڭ ئىستىققىسىنىڭ زور دەرىجىدە ئېشىشىغا ئېرىشتى, بولۇپمۇ خېلى يېنىكلىكتىكى جۇڭگو سۇنى ئومۇميۈزلۈك گەۋدە قىلىپ, جۇڭگو ئاھالىلىرىنىڭ ئېھتىياجىغا ئېرىشكەن تېخىمۇ كۆپ مەھسۇلاتلارنى بىرلەشتۈرۈشتىن باشلاپ, جۇڭگو ئاھالىلىرىنىڭ چەتئەلدىكى سېتىلىشىنى بىرلەشتۈرۈشتىن مۇھىمراق. خەنزۇچە پېچىنە-پىرەنىكنىڭ ئالاھىدىلىكىگە ئاساسەن, توڭلىتىلغان خېلغەتلىك ھوراننىڭ سۈپىتىنىنى ياخشىلاش, توڭلاتقۇنىڭ ئالاھىدىلىكىگە ئاساسەن توڭلىتىدىغان خېمىرەتنىڭ سۈپىتىنى ئۆستۈش, جۇڭگو پېچىنە-پىرەنىرىنىڭ بىر تەرەپ قىلىش ئالاھىدىلىكىگە ماس كېلىدۇ.
بۇ چوقۇم Enpriset نىڭ جۇڭگو چۆكۈلمىلىرىدىكى مۇناسىۋەتلىك قوللىنىشچان تەتقىقات سەۋەبىدىن يەنىلا كەم بولسا بولىدۇ. شۇڭلاشقا, بۇ تەجرىبەنىڭ مەقسىتى HPMC نىڭ توڭلىتى ۋە توڭلىتىلغان خېمىر ئارقىلىق HPMC ئارقىلىق HPMC ئارقىلىق HPMC ئارقىلىق توڭلىتىلغان خېمىر تەرەپنىڭ ياخشىلىنىشىنى چىقىرىپ, ھورۇن بىر نەچچە ھالكۇللېي خېمىرنى ئېچىش. بۇنىڭدىن باشقا, HPMC خېمىرىن (بۇغداي دېسوغلانچە, كرەت, شاھزات سۇيۇقلۇقى) نىڭ ئۈچ چوڭ تەركىبلىرىگە قوشۇلدى ۋە بۇغداينى ئاقلاش ۋە خۇتەكنىڭ قۇرۇلمىسى ۋە خالشىشى سىستېمىلىق تەسىرى سىستېمىلىق تەتقىقاتى سىستېمىلىق پىلانلانغان. ھەمدە مۇناسىۋەتلىك مېخانىزي خېمىرنىڭ ئۆسۈش ئۇسۇلى ئۈچۈن يېڭى مۇمكىن, چۈنكى, توڭلىگىلى بولىدىغان گازنىڭ يېمەكلىك ئورنىنى ئاشۇرۇش ئۈچۈن يېڭى مۇمكىن, ھەمدە يېمەكلىك دۇنياسىدا HPMC نىڭ ئىشلىتىش ھوقۇقى بولۇپ, توڭلىتىلغان خېمىنى ئوغرىلىق بىلەن ماس ھالدا قوللاشقا ماس كېلىدۇ.
1.3 تەتقىقاتنىڭ ئاساسلىق مەزمۇنى
ئۇ ئادەتتە ئۇ خېغىتىنىڭ كۆپ تەركىبدىكىلەرنىڭ ئالاھىدىلىكى, كۆپ مىقداردىكى يۇمشاق دېتال ۋە كۆپ خىل ھالەتكە ئوخشاش تىپىك يۇمشاق مەسىلە ۋە كۆپ خىل شەكىلدە يۇمشاق يۇمشاق دېتال سىستېمىسىنى ئۆزگەرتتى دەپ قارا رەڭلىك يۇمشاق مەسىلە.
توڭلىتىلغان خېغىر ۋە خۇلەئاسى ۋە خۇسۇسىلىنىشنىڭ قۇرۇلۇشى ۋە توڭلىتىلغان ساقلاش ۋاقتىغا تەسىر كۆرسىتىدۇ, توڭلىتىلغان نۇقالىق مەھسۇلاتلىرى), بۇغدېگر كپۇرگىنىڭ قۇرۇلمىسى ۋە مال-مۈلۈكلىرى ۋە ئېچىلغانلىقى ۋە يېقىشلىق بولغان تىغ ئۇچىنى ئىگىلەيدۇ. يۇقارقى ئويلىنىشنى ئاساس قىلىپ, تۆۋەندىكى تەجرىبىلىك تەجرىبە لايىھىسى بۇ تەتقىقات تېمىسىدا كۆرۈلدى:
1) يېڭى تىپتىكى گىدروگرافىنى تاللاڭ, Heddroyprowyl Methylcelluclse (HPMC) قالايمىقانلىشىپ, YPMC نىڭ قوشۇلما قىممىتى تۆۋەنلىتىلىدۇ (0, 15, 60 كۈن. (0%, توڭڭى توڭلىتىلغان خېمىرنىڭ بىر تەرەپ قىلىش خۇسۇسىيىتىدە HPMC
2) ياخشىلاش مېخانىزمىنىڭ كۆزگە ئايلىنىشى, سۇ كۆلىمى ئۆتۈنۈپ, سۇ دۆلىتى ۋە قاناشنىڭ قۇرۇلمىسى ۋە بۇغداي گوللاندىيە يېغىلغۇنىڭ قۇرۇلمىسى ۋە مال-مۈلۈكلىرى ئوخشىمىغان توڭلىتىش ۋاقىت ۋاقىت شارائىتى ئاستىدا.
3) ياخشىلاش مېخانىزمىنىڭ كۆزگە كۆرۈنەرلىك بولغان تەرەپ, گۆشسىز ساقلانمىلار, گرمۇزلاشتۇرۇش ماھىيىتىنىڭ ئوخشىمىغان HPMC نى, گرمۇشلاشتۇرۇش مۈلكىنىڭ تەسىرى ئوقۇلدى,
4) تەپسىلاتىنىڭ ياخشىلىنىشى, ھايات قېلىش نىسبىتى قاتارلىقلاردىكى نىسبەت, ھاياتنىڭ يېغىش نىسبىتىدىكى ئوخشىمىغان HPMC قوشۇش شارائىتىنىڭ تەسىرىدە ئېچىلغان HPMC قوشۇش شارائىتىنىڭ تەسىرىدە ئېچىلدى.
2-باب I-IPMC نىڭ توڭلىتىلغان خېمىر پىششىقلاپ ئىشلەش خاسلىقى ۋە ھور سۈپىتى
2.1 تونۇشتۇرۇش
ئومۇمەن قىلىپ ئېيتقاندا, ھەق بەرگەن ئۇن ئېچىش ئۈچۈن ئىشلىتىلگەن ماتېرىياللارنىڭ ماتېرىيالى, قوغداش), جاراڭلىق سۇ ياكى ئورگانىك سۇ, ئورگانىك سۇ ياساشلىرى ۋە ئوررىكلىق ۋە ئۆز-ئارا تەسىر كۆرسىتىشتىن كېيىن ياسالغان. ئالاھىدە قۇرۇلما بار مۇقىم ۋە مۇرەككەپ ماتېرىياللار تەرەققىي قىلدى. نۇرغۇنلىغان تەتقىقاتلار خېمىرنىڭ خالتىسى ئەڭ ئاخىرقى مەھسۇلاتنىڭ سۈپىتىگە دۇچ كەلگەنلىكى كۆرسىتىلدى. شۇڭلاشقا, كونكرېت مەھسۇلاتنىڭ مەھسۇلات ياكى ئىشلىتىلىدىغان يېمەكلىك ياكى ئىشلىتىلىدىغان خېمىر تۈزۈش ۋە تېخنىكىسىنى ياخشىلاش ئۈچۈن بىر تەتقىقات يۆنىلىشلىشىش قىلىدۇ. مەھسۇلاتنى پىششىقلاپ ئىشلەش ۋە قوغداشنىڭ خۇسۇسىيىتىنى ياخشىلاش, ياخشىلاش ياكى ياخشىلاش مۇھىم تەتقىقات مەسىلەمۇ بولىدۇ.
تونۇشتۇرۇشتا HPMC نى خېما سىستېمىغا قوشقان ۋە خېمىرلاش, كۇڭتۇڭ, شىڭولوگىيە قاتارلىقلارنىڭ تەسىرىنى تەكشۈرۈش ۋە ئاخىرقى مەھسۇلات سۈپىتىنىڭ تەسىرىدە ئىككى خىل يېپىشقاق مۇناسىۋەتلىك تەتقىقاتلارنى تەكشۈرۈش.
شۇڭلاشقا, بۇ تەجرىبە لايىھىسى ئاساسلىقى ئىككى تەرەپتىن ئېلىپ بېرىلدى: HPMM نىڭ توڭگېن خېبرەم سىستېمىسى ۋە پارتلاش ئىقتىدارىغا ئۇچرىغان.
2.2 تەجرىبە ماتېرىياللىرى ۋە ئۇسۇللىرى
2.2.1 تەجرىبە ماتېرىياللىرى
Zhongyu بۇغدۇ بۇغداي بىنسۇج بىناخۇ? پەرىشتە ئاكتىپ قۇرغۋاق شەرىئال شەربىتى HPMC (Methyl نىڭ ئورنىنى ئېلىش نىسبىتى% 28.% 8,% 5) ئالدرويپا (شياڭگاڭ) خىمىيىلىك پۇلنى قايتۇرۇش شىركىتىنى% 7. بۇ تەجرىبىدە ئىشلىتىلىدىغان بارلىق خىمىيىلىك ئىجارە ئاجرىتىلغان بارلىق سىناق دەرىجىسى
2.2.2 تەجرىبە ئەسكىرى ۋە ئۈسكۈنىلىرى
چالغۇ ۋە ئۈسكۈنىلەرنىڭ ئىسمى
BPS. 500 ئادەم توختىماي تېمپېراتۇرا ۋە نەملىك ساندۇق
TA-RTSTAL STANCE SPACKE SILLISS TESTER
BSAL24S4s ئېلېكترونلۇق تەھلىل قىلىش تەڭپۇڭلۇقى
Dhg. 9070a پارتىلاش ئوچاق
Sm. 986s خېمىر ئارىلاشتۇرۇلغان
C21. Kt2134 Incuction couter
پاراشوك مېتىر. E
كېڭەيتىش. E
R3 ئايلىق رېشاتكىسى
Q200 پەرقلىق سىكانىرلاش ئىسسىقلىق ئۆيى
Fd. 1b. 50 ۋاكۇئۇمنى توڭلىتىدۇ
SX2.40.10 مۇپكە يەتتى
KJېلېتېر TM 8400 ئاپتوماتىك كىيەلەلگەن ئانتروگېن ئانالىزچىسى
ئىشلەپچىقارغۇچى
شاڭخەي جخېڭ ئىلمىي ئىلمىي ۋاگېن چەكلىك شىركىتى چەكلىك.
Crabic mice use, uk
Sartorius, گېرمانىيە
شاڭخەي جخېڭ ئىلمىي ئىلمىي ۋاگېن چەكلىك شىركىتى چەكلىك.
ئەڭ يۇقىرى ئاشخانا ئېلېكتر ئۈسكۈنىلىرى تېخنىكا چەكلىك شىركىتى.
گۇاڭدۇڭ سەلادلىقلار تۇرمۇش ئېلېكتر ئۈسكۈنىلىرى ئىشلەپچىقىرىش C., LTD.
Briberder, گېرمانىيە
Briberder, گېرمانىيە
ئامېرىكا TA شىركىتى
ئامېرىكا TA شىركىتى
بېيجىڭ بويۇم بوڭ تەجرىبە ئەسكىرى چەكلىك شىركىتى.
خۇاڭ شى خېڭ فېڭ فېڭ داۋالاش ئۈسكۈنىلىرى چەكلىك شىركىتى LTD.
دانىش تاشقا
2.2.3 تەجرىبە ئۇسۇلى
2.2.3.1 ئۇننىڭ ئاساسىي زاپچاسلىرىنى بەلگىلەش
GB 50093.2010, GB 5009.510, Gb / T.99.2008, بۇغداي ئۇنلىقى - نەملىك, ئاقسىل, كاۋاپ ۋە كۈل مەزمۇن بولۇشنىڭ ئاساسىي تەركىبىي قىسمى.
2.2.3.2 گۈللۈكنىڭ پاخۇشىنى بەلگىلەش
پايدىلىنىش ئۇسۇلى GB / T 14614.2006 خېمىرنىڭ خېمىرتۇرۇلۇشىنىڭ دەرىجىسىنى بەلگىلەش.
2.2.3.3 جىددىيلىك خۇسۇسىيىتىنى بەلگىلەش
GB / T نىڭ GB / t 14615.2006 غا ئاساسەن جىددىيلىك خۇسۇسىيىتىنى بەلگىلەش.
2.2.3.4 توڭلىتىلغان خېمىر
GB / T 17320.1998 نىڭ قىچا ياساش جەريانىنى كۆرۈڭ. ئېغىرلىقىڭىز بوغۇزىنى ياخشى قاچىلاش, خېمىر بوغۇزىقى بوغۇزىقىدىكى رولنى ئېگىز ئارىلاشتۇرۇپ, سائەت 24 مىنۇت 180G / بىر بەت شەكلىگە سىلىندىر شەكىلگە كىرىپ, ئۇنى Ziplick بىلەن پېچەتلەش, ھەمدە% 0.5 (% 15 ° C (% 15 ° C (1 كۈنلۈك توڭلىتىلغان ساقلاش) ئۆزگەردى كونترول تەجرىبە گۇرۇپپىسى.
2.2.3.5 رېئولوگىيەلىك خۇسۇسىيەتنى بەلگىلەش
مۇناسىپ توڭلىتىش ۋاقتىدىن كېيىن تېرىلىك ئەۋرىشكە تەييارلاڭ, ئۇلارنى توڭلاتقۇغا سېلىڭ, ئاندىن ئۇلارنى ئۆي تېمپېراتۇرىسىدا پۈتۈنلەي ئېرىپ كەتتى. ئەۋرىشكىسىنى پىششىقلاپ ئىشلەش ئۇسۇلى تەجرىبە) مۇرەككەپ قىسىم قىسمىمۇ ئىشلىتىلىدۇ.
قىسمەن ئېرىتىلگەن خېمىرنىڭ مەركىزى (تەخمىنەن 2 گرام) نىڭ ئەۋرىشكىسى ياكى رېمونت قىلغۇچىنىڭ ئاستى تەخسىگە قويۇلغان. بىرىنچىدىن, ئەۋرىشكى ھەرىكەتچان بېسىملىق سايىلەپ, ئەۋرىشكە ئېلىپ بېرىلىپ قالدى. كونكرېت تەجرىبە پارچىلىرى تۆۋەندىكىچە: 40 مىللىمېتىردا 40 مىللىمېتىر ئىشلىتىلگەن: پەرقلىق بولۇپ, تېمپېراتۇرا 100 ° ° ° كىمۇ يەتكەن, سايىلەش دائىرىسى 25.01 بولسا. 100%, ئەۋرىشكە دەم ئېلىش ۋاقتى 10 مىنۇت, چاستوتىسى 1Hz غا تەڭشەلدى. سىناق قىلىنغان ئەۋرىشكە (LVR) STROCKED SPORDS نىڭ (LVR) بېسىملىق سىكانىرلاش ئارقىلىق بېكىتىلدى. ئاندىن, ئەۋرىشكا ھەرىكەتچان چاستوتا ئورالغان بولۇپ, كونكرېت ھەرپلەر تۆۋەندىكىچە, جىددىيلىشىپ, نىسبىتى% 0.5 0.5.% 0.5.% 0.5 بولدى. بەش سانلىق مەلۇمات نۇقتىسى (پىلان) چاستوتا (سىزىقلىق ھالەت) نىڭ ھەر 10 ھەسەل سىرتىدىكى ھەر 10 ھەسسە كۆپەيتىش ئۈچۈن رېئوگىيەلىك (سىزىقلىق ھالەت). ھەر بىر قىسقۇچنىڭ سۈزۈلمىگەندىن كېيىن, ئارتۇق ئەۋرىشكە تىغ بىلەن تەۋرىنىشتى, ئاستا-ئاستا پاراق, پاراشوتتىن قەۋەتنىڭ چېتى ئەۋرىشكىنىڭ چېتى سۇس قويۇلغان بولۇپ, تەجرىبە مەزگىلىدە سۇ يوقىتىۋېتىشىنىڭ ئالدىنى ئالدى. ھەر بىر ئەۋرىشكى ئۈچ قېتىم تەكرارلاندى.
2.2.3.6 نىڭ مەزمۇنى (توڭلىغىلى بولىدىغان سۇنىڭ مەزمۇنى) خېمىردىكى CF ئىچكى ئىرادىسى)
تولۇق ئېرىتىلغان خېغىرىنىڭ مەركىزى قىسمىدىن تەخمىنەن 15 مىللىگىرام ئەۋرىشكە پېچىنە (سۇيۇق ئەۋجەللىك ئەۋزەللىكىگە ماس كېلىدۇ), ئۇنى پەرقلىك ساناقلىق Halorytry (DSC) بىلەن ئۆلچە. كونكرېت پروگرامما پارامېتىرلىرى بېكىتىلدى. تۆۋەندىكىچە: ئالدى بىلەن 20 ° C دىن ئېشىپ, ئاندىن 10 مىنۇت ساقلىغاندا, ئاخىرى 25 مىنۇت ساقلىغاندا, پاكلىق گازى كېيىن 25 كىلوگرام ئۆرلەڭ (N2) ۋە ئېقىمى 50 مىللىمېتىر كېلىدۇ. پايدىلىنىش ماتېرىيالى سۈپىتىدە دەرىجىگە ئايرىلغان قۇرۇق ئاليۇمىننى ئىشلىتىپ, DSC ئەگرى سىزىقلىق ئانالىزچىدىن 2000-بەت ۋە مۇز Entathlpy (بىر كۈن) مۇزلۇقنىڭ سېتىلىشى 0 ° C قاتارلىقلارنى بىرلەشتۈردى. توڭلىتىش سۇ تەركىبى (CFW) تۆۋەندىكى فورمۇلا تەرىپىدىن ھېسابلىنىدۇ [85.86]:
بۇنىڭ ئىچىدە نەملىكنىڭ ھۈجاپىسى دائىرىسىگە ۋەكىللىك قىلىدۇ, قىممىتى 334 JU دان. MC (ئومۇمىي نەملىك مىقدارى) خېمىردىكى ئومۇمىي نەملىك مىقدارىغا ۋەكىللىك قىلىدۇ (GB 50093.2010T78 بىلەن ئۆلچىنىدۇ]). ھەر بىر ئەۋرىشكى ئۈچ قېتىم تەكرارلاندى.
2.2.3.7 نان ئىشلەپچىقىرىشى
مۇناسىپ جاھىللىقتىن كېيىن, توڭلىتىلغان خېمىر سىرتقا چىققاندىن كېيىن, ئالدى بىلەن 4 ° C توڭلاتقۇدا بولۇپ, ئاندىن ئۆي تېمىسىنى پۈتۈنلەي ئېرىدى. خېمىنىڭ بىر قىسمىغا يېقىنلاشقان گرامنى شەكىللەندۈردى, ئاندىن ئۇنى توختىماي تېمپېراتۇرا ۋە نەملىك ساندۇققا بېرىڭ, ھەمدە ئۇنى 30 ° C ۋە نىسپىي نۇقسانكىسى 30 گرام. ئىسپاتلانغاندىن كېيىن, ھور 20 مىنۇت, ئاندىن ئۆينىڭ تېمپېراتۇرىسىدا 1 سائەت سوۋۇتۇش.
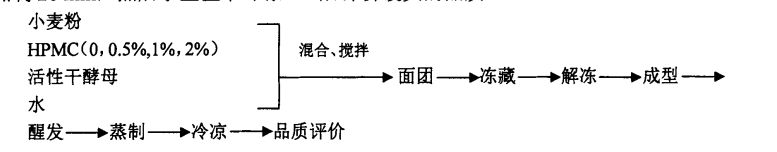
2.2.3.8 ھورنىڭ سۈپىتىنى باھالاش
(1) ھوردىن كەلگەن ناننىڭ كونكرېت مىقدارىنى بەلگىلەش
GB / T 20981.2007 [871 [871) ھوردىن ياسالغان بىر بورنىڭ ئاۋازى (M) نىڭ ئاۋازى (خىزمەت) ھەر بىر ئەۋرىشكە ئۈچ قېتىم كۆپەيتىلدى.
ھورلانغان بولكا ئالاھىدە ھەجىم (cm3 / g) = ھوردا نان (CM3) / ھور (cm3) / ھور (GM)
(2) ھور دەۋرىدىكى پارتلاش خاسلىقى
SIM, نۇتۇق دۇنياۋى, چېڭ (2011) [8] [ھازىرقى ئۆزگەرتىشلەر بىلەن) [88] [88] [88] [88] [88] [88] [88] [88] [ھازىرقى ئۆزگەرتىشلەر. ھوردىن 20x 20 x 20 mn'13 يادرولۇق بولكا پارلامېنت ئەزالىرىنىڭ مەركىزى ناندىن ياسالغان كونكرېت پارامېتىرلار: تەكشۈرۈش نىسبىتى PM / 100 بولۇپ, ئوتتۇرا ئۆلچەمدىن كېيىنكىت مىقدارى 1 MM / S. ھەر بىر ئەۋرىشكىدىن 6 قېتىم تەكرارلاندى.
2.2.3.9 سانلىق مەلۇمات بىر تەرەپ قىلىش
باشقىچە بەلگىلىمە چىقىرىلمىسا, باشقىچە بەلگىلەنگەن بولسا, تەجرىبە نەتىجىسى ئاساسەن (مەنىلىك) ± ئۆلچەملىك ياتلىشىش (ئۆلچەملىك ياتلىشىش) دەپ قارالدى. Spss StarkICIS 19 ئېغىزىنى تەھلىل قىلىشقا ئىشلىتىلگەن (ئوخشىماسلىق, ئارا ۋە ئىنجىل مۇھىتى). 8.0 نى ئىشلىتىپ مۇناسىۋەتلىك جەدۋەللەرنى سىزىڭ.
2.3 تەجرىبە نەتىجىسى ۋە مۇنازىرە
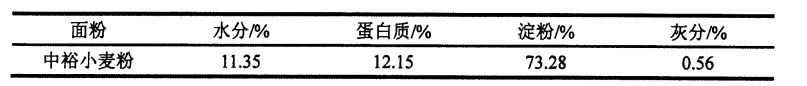
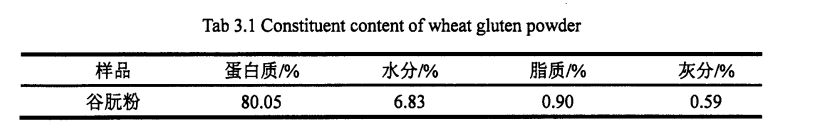
2.3.1 بۇغداي ئۇننىڭ ئاساسىي تەركىبى
بۇغداي ئۇننىڭ باشلانغۇچ تەركىبلىرىنىڭ باشلانغۇچ تەركىبلىرى
2.3.2 I-IPMC نىڭ ۋاشىنگېردىكى ھادىسەنىڭ تەسىرىگە قوشۇلۇشنىڭ تەسىرى
2.2 جەدۋەلدە كۆرسىتىلگەندەك, HPM نىڭ كۆپىيىشى كۆرۈنەرلىك بولغاندا, خېمىر ئۆسۈش نىسبىتى% 5.60 ئېشىپ,% 2 HPM SoGh) نى قوشىدۇ. بۇنىڭدىن باشقا, HPMC نىڭ قوشۇلۇشىدىن كېيىنكى مەركىزى 5.2 مىنۇت (قۇرۇقلۇق) دىن 12.2 مىنۇت (% 2 HPMC) نى كۆپەيتىڭ. قانداقلا بولمىسۇن, HPMC NO سىنىڭ% 55.0M لىق بولۇپ, قۇرۇق خېمىرنىڭ ئاجىزلىنىشى ئومۇمىي جەھەتتىن 55.0 ۋە ئاجىزلىقتا بولۇپ, ئايرىم-ئايرىم ھالدا% 18.57 تۆۋەنلىگەن.
چۈنكى HPMC نىڭ كۈچلۈك سۇنى ساقلاپ قېلىش ۋە سۇ ساقلاش ۋە سۇ ئېچىش. خېلى خان جەمەتى كۆتۈرۈش نىسبىتى تېخىمۇ ياخشى بولىدۇ. خېغىرى ئېچىنىشلىق ۋاقىتخان تۇغۇپ, HPMC توقۇلغان ۋاقىتنى كونترول قىلىدۇ خېغىرىنىڭ شەكىللىنىشى. خېمىردەك مۇقىملىق ۋاقتى 500 فۇنىڭ ئۈستىگە چىقىرىلغان ۋاقتى, ئۇ ئەينىزامىغا يەتكەندە خېيى ۋە نىسبەت بويىچە خېيى, ئۇ ئاجىزلىق دەرىجىسى يۇقىرىدىن ھالقىپ كېتىش دەرىجىسى خېمىر كېلىدىغان ۋە ئاخىرقى ئىزچىللىق بىلەن HPMC تەرىپىدىن خېمىرتۇرۇلىنىڭ كۆرسىتىلىشىدە, HPMC نىڭ خېمىلدىكى مۇقىملىقىنى مۇقىملاشتۇرۇپ بولغانلىقتىن, HUGM نى ئاجىزلاش ۋاقتى لەر ۋە HUGM نىڭ مۇقىملىقى, HPMC نىڭ مۇقىملىقى, بۇ نەتىجىلەر Hought ۋە Hars نىڭ تەتقىقات نەتىجىسىنى ئۆزگەرتكەنلىكىنى كۆرسىتىپ بېرىدۇ, بۇ نەتىجىلەر
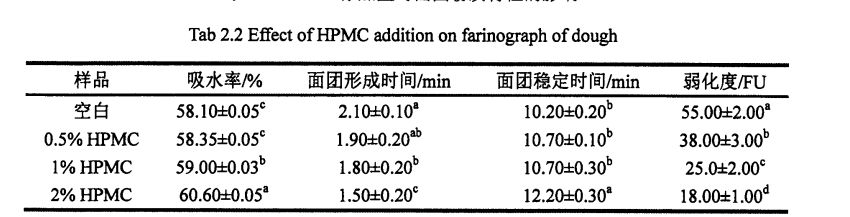
ئەسكەرتىش: ئوخشاش ئىستوندىكى ئوخشىمىغان دەرىجىدىكى دەرىجىدىن تاشقىرى خەت (P <0.05)
2.3.3 HPMC نىڭ خېمىر تىكىش خۇسۇسىيىتىدىن باشقا
خېمىردىكى بىرلىككە كەلگەن خۇسۇسىيەت دەلىل-ئىسپات, جىددىيلەشتۈرۈش, جىددىي قارشىلىق ۋە سوزۇلۇش نىسبىتىنىمۇ ياخشى ئەكس ئەتتۈرەلەيدۇ. خېمىردىكى بىرلىككە كەلگەن خۇسۇسىي خۇسۇسىيسى بولغاچقا, خېمىرنى كېڭەيتىش رولىدىكى ئۇزۇنلۇقتىكى كەڭلىكتىكى چوڭ چىراغنىڭ كېڭەيتىلمىسىغا خاس تەسەللىلەشنى بەلگىلەيدۇ [921]. ۋاقىت دېمىسى, سىمىس (1987) [93] ئەتراپتىكى بىر چەمبىرەك زەنجىرىنىڭ ئارىلىقى زەنجىرى ئارىلىقىدا ئىككىلەمچى زەنجىرسىمان زەنجىرگە باغلىق. مولېكۇلا زەنجىرىنىڭ ئۆزگىرىشى بىر قەدەر تۆۋەن, مولېكۇلا زەنجىرنىڭ بۇزۇلۇشى يېتەرلىك بولىغا قويۇشقا, مولېكۇلي زەنجىرنىڭ كېڭەيتىش ئۇزۇنلۇقىنىڭ تېز بولۇشىمۇ قىسقا. مولېكۇلي زەنجىرىنىڭ ئۆزگىرىشى نىسبىتى پەقەت مولېكۇل ھاكىمىيەت زەنجىرسىمان زەنجىرسىمان زەنجىرسىمان زايوم زايوكىنىڭ خەۋەرلىشىشتۈرۈشىگە كاپالەتلىك قىلالايدۇ, مولىك زاپىسى يۈز بەرگىلى بولمايدۇ, كۆپ ئىقتىدارلىق پۇلنى كۆپەيتىشكە كاپالەتلىك قىلالايدۇ. شۇڭلاشقا, گلتىرى ئاقسىل زەنجىرنىڭ چىقىم زەنجىسىنىڭ تارقىلىش ۋە ئارىسىنىڭ ئۆزگىرىشى ۋە كېڭەيتىش خاھىشىسىنىڭ ئورنى بولىماقتا, خېڭنىڭ جىددىيلۈك دەرىجىسىگە ئېلىپ كىرىش [92].
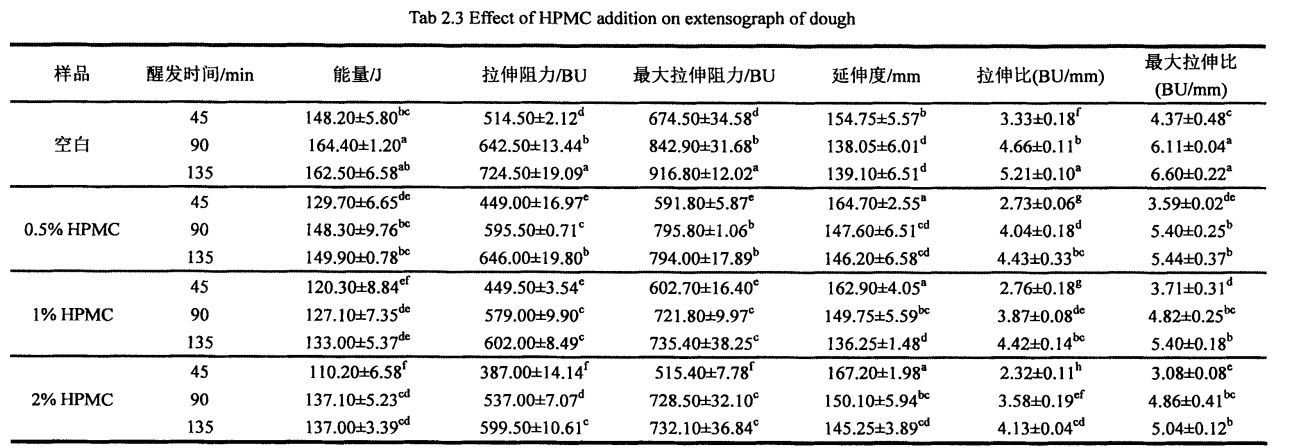
جەدۋەل 2.3 ئوخشىمىغان مىقداردىكى HPMC نىڭ تەسىرى (O قاتارلىق% 1.5 ۋە% 1) ۋە ئوخشىمىغان ئىسپاتلار 1'9 (45 مىنۇت, 95 مىنۇت, 95 مىنۇت, بۇزۇلۇش, ئەڭ يۇقىرى چەككە سېلىشتۇرۇش, ئەڭ ئۇزۇن چەك, يۇقىرى ئۆرلەش نىسبىتى ۋە مەركەزلىك نىسبىتى ۋە مەركەزلىك نىسبەت بويىچە). تەجرىبە نەتىجىسىدە كۆرسىتىلىشىچە, بارلىق خېمىر ئەۋزەللىكنىڭ ئىسپاتىنىڭ ئۇزارتىلىشى بىلەن ئازىيىشى بىلەن ئازىيىشى بىلەن ئۇزارتىلىدىغان كېڭەيتىلىش ۋاقتىنىڭ ئىسمىنى ئۇزارتىش ۋاقتى بىلەن ئاشىدىكەن. ئېنېرگىيە قىممىتى 0 دىن 90 مىنۇتقىچە, باشقا% 1 لىك يۇقىرى ئۆرلەش نىسبىتى تەدرىجىي بار ئاستا, بارلىق يۆتەلنىڭ ئېنېرگىيە قىممىتى تەدرىجىي ئاشتى. كۆرۈنەرلىك ئۆزگىرىش بولمىدى. بۇ كۆرسىتىپ, تەكشۈرۈش ۋاقتى 90 مىنۇت بولغاندا, خېمىرنىڭ تور قۇرۇلمىسى (مولېكۇلا زەنجىرى ئارىسىدا يۈزلىنىش) پۈتۈنلەي شەكىللەنگەن. شۇڭلاشقا, ئىسپاتلاشتۇرۇش تېخىمۇ كېڭەيتكەن, ئېنېرگىيە قىممىتىدە كۆرۈنەرلىك پەرق يوق. شۇنىڭ بىلەن بىر ۋاقىتتا, بۇ يەنە خېمىرنىڭ ئىسپاتلانغان ۋاقتىنى بەلگىلەشكە بولىدۇ. مولېكۇلا زەنجىرىنىڭ سابىق نەتىجىسى بولۇپ, مولېكۇلا زەنجىرىنىڭ ئارىسىدىكى ئۇزۇنلۇق زەنجىرلىرى قۇرۇلدى, شۇڭا جىددىيلىك قارشىلىق ۋە ئەڭ يۇقىرى نازارەت قىلىش ئىقتىدارى تەدرىجىي كۈچى تەدرىجىي كۈچىيىدۇ. شۇنىڭ بىلەن بىر ۋاقىتتا, مولېكۇلياكات زەنجىرىنىڭ چېكى ئۆزگىرىشىدە, مولېكۇل ھاكىرى زەنجىرى ئوتتۇرىسىدىكى چاستورلۇق زەنئىنىڭ ئوتتۇرىسىدا يېپىق ئۆرلەش نىسبىتى تۆۋەنلىدى, بۇلارنىڭ ئىسپاتلانغان ئۇزاق ئۆتۈشىنىڭ ھەددىدىن زىيادە ئۇزارتشىنى ئازايتقىلى بولىدۇ. جىددىيلىك قارشىلىق / ئەڭ يۇقىرى ئىجادىيەتكە قارشى تۇرۇش كۈچى, ئۇزۇنلۇقتا كېڭىيىدۇ ۋە ئۇزۇنلۇقتىكى جىددىيلىكنىڭ كۆپىيىشى ھېسابلانغان.
قانداقلا بولمىسۇن, HPMC نىڭ قايتا ئورنىدىن باشلاپ يۇقىرىدىكى يۈزلىنىشنى ئۈنۈملۈك كۆرسىتىپ, خېمىرنىڭ ماسلىشچان خاسلىقىنى ئۆزگەرتىدۇ. HPMC Leca نىڭ كۆپىيىشىگە ئەگىشىپ, بىر قەدەر كەڭ كۆلەملىك, ئېگىزلىكىنىڭ ئەڭ داڭلىق بولغان مەبلەغ قىممىتى مۇناسىپمۇ مۇناسىپ تۆۋەنلىگەن, ئۇزۇن ئۆتمەيلا ئۆرلىگەن. كونكرېت قىلىپ ئېيتقاندا, ۋاقىت تەكشۈرۈش ۋاقتى 45 مىنۇلغا بولغاندا, ئۇلۇتنىڭ قۇچىقىنىڭ كۆپىيىشىدە, 148.20-نومۇر), 120.80 ±% 1.20.20-a: 6.58
J (% 2 HPMC قوشۇلدى). شۇنىڭ بىلەن بىر ۋاقىتتا, ھويلىنىڭ Ra: 3918 دىن تۆۋەنلىتىلگەن. قانداقلا بولمىسۇن, خېفنىڭ تېرىدى 154.75 + 7.507 مىچى (FPLANT% 0.5 M دىيۇم), 1625 مىنۇت قوشقان), ۋە 1 67.20-a. HLutuen ئاقلىنولىنىڭ شېخىليات زەنجىرىنىڭ ئۆسۈشى بىلەن ئۇ توختىماي ھەرىكەتلەندۈرگۈچ كۈچنىڭ ئۆسۈشى بىلەن ئۇنى تەسىر كۆرسىتىدۇ, بۇ ئىتنىڭ ئۇزۇنلۇق خۇسۇسىيىتىنى ئۆستۈرىدۇ ھەمدە خېمىرنىڭ ئارتۇقچىلىقىدىن ئۆتىدۇ, بۇ سۈپەتكە تەسىر كۆرسىتىدۇ (مەسىلەن, ئاخىرقى مەھسۇلاتنىڭ كونكرېت ھەجىمى, تېكىست).
2.3.4 HPMC قوشۇلۇشى ۋە خېمىرنىڭ رىياسەتلىك خۇسۇسىيىتىدىكى ساقلاش ۋاقتى
خېمىرالىق ئادەتنىڭ مۇھىم خۇسۇسىيىتىنىڭ مۇھىم كۆزلىرىنى مۇرەككەپلىك قىلىش, مۇقىملىق ۋە بىر تەرەپ قىلىش ئالاھىدىلىكى, پىششىقلاپ ئىشلەش ۋە ساقلاشتىكى قاناتلارنىڭ ئۆزگىرىشى سىستېمىلىق ئىشلىتىلىشىگە سىستېما.
توڭلىتىلغان خېمىرنىڭ رىياسەتچىسىدىن ئايرىلغان
2.1-رەسىم 01-رەسىم 0 كۈن ساقلاش لايىھىسى (Elasicick, G »(Viscus Modulus, g») نىڭ ئۆزگىرىشىدا, G "خېمىرنىڭ ئۆزگىرىشى كۆرۈنەرلىك تۆۋەنلەپ, كىرىدۇ, ئۇنىڭ ئۆزگىرىشى بىر قەدەر كىچىك بولۇپ,. بۇ بەلكىم ھەمبىرەك تور قۇرۇلمىسىنىڭ تور قۇرۇلمىسىنىڭ مۇز قۇرۇلمىسى بىلەن بولغان بولۇپ, توڭلىتىش كۈچىنى تۆۋەنلىتىدۇ,, قۇرۇلما خاراكتېرلىك كۈچنى تۆۋەنلىتىدۇ, شۇڭا ئېلاسادىك مۇتسىياسىنى كۆرۈنەرلىك تۆۋەنلىتىدۇ. قانداقلا بولمىسۇن, HPMC دىن باشقا, G ئاستا-ئاستا ئۆزگىرىشى بىلەن. بولۇپمۇ, HPMC نىڭ قوشۇلما قىممىتى% 2 بولغان بولسا, G 'نىڭ ئۆزگىرىشى ئەڭ كىچىك ئىدى. بۇ كۆرسىتەلمەكتە HPMC مۇز خرۇستال شەكىللىنىشىنى ئۈنۈملۈك چەكلەپ, مۇز خرۇستال چوڭلۇقىدىكى ئېشىش سۈرئىتىنى ئازايتالايدۇ ھەمدە خېمىر قۇرۇلمىنىڭ بۇزۇلۇشىنى ئازايتالايدۇ ۋە خېفنىڭ قۇرۇلمىسى يارىلىنىشىنى كەلتۈرۈپ چىقىرىدىغانلىقىنى ۋە خېمىرنى ساقلاپ قالىدۇ. ئۇنىڭدىن باشقا, خېمىرنىڭ قىممىتى ھۆل گللۇلې خېغىنىڭ ھۆل گلۇمۇ خېمىرىنىڭكىدىن كۆپ, چۈنكى چىڭ تۇرغانلىقى ئۈچۈن ئاساسلىقى گللا تورى قۇرۇلمىسىغا تاپقىلى بولىدۇ. ئۇ ئارتۇقچە تور قۇرۇلمىسىغا ساقلاپ قېلىشقا توغرا كېلىدۇ. ئۇ ئارتۇقچە تور قۇرۇلمىسىنى ساقلاپ قېلىندى.
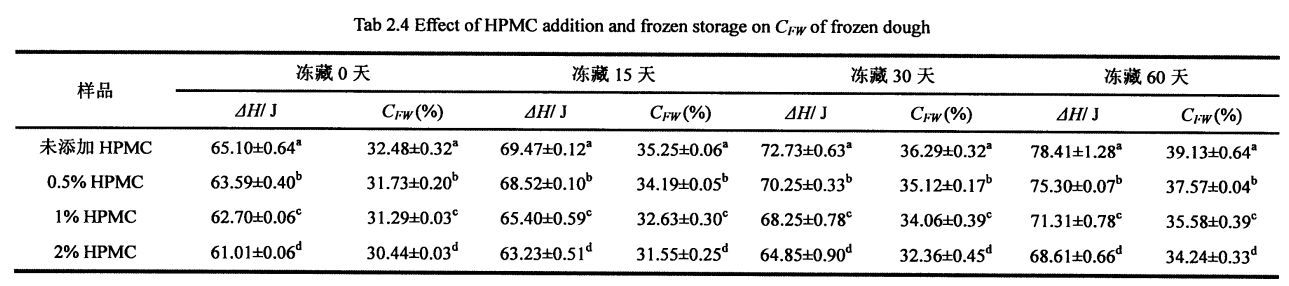
FPMC قوشۇلۇشى ۋە توڭلىتىلغان سۇ مەزمۇنىدا توڭلىتىلغان سۇ مەزمۇنى (ئىگىدارچىلىق قىلىدىغان سۇ مەزمۇنى)
خېمىكىنىڭ بارلىق نەسلىنىشىسى, مەلۇم تۆۋەن تېمپېراتۇرا شەكىللەندۈرەلمەيدۇ, بۇ بولۇپ, نەملىك قاتارلىق نەملىكە (ھەقسىز ئاق, چەكلەيدۇ) ۋە ئۇنىڭ مۇھىتىغا مۇناسىۋەتلىك. توڭلاتقۇ سۇ تۆۋەن تېمپېراتۇرىدا مۇز كىرىستالنى شەكىللەندۈرىدۇ. توڭلىغىلى بولىدىغان سۇنىڭ مىقدارىغا بىۋاسىتە تەسىر كۆرسىتىدىغان, چوڭلۇق ۋە تارقىتىشنىڭ ئۆزگىرىشىگە بىۋاسىتە تەسىر كۆرسىتىدۇ. بۇنىڭدىن باشقا, توڭلاتقى بولىدىغان سۇ تەركىبى مۇھىت ئۆزگىرىشلىرىنىڭ تەسىرىگە ئۇچرىغان, مەسىلەن مۇھىت ئاستى ساقلاش ۋاقتىنىڭ كېڭەيتىلىشى, ساقلاش ساقلاش تېمپامىتكىنىڭ خاتاغ, ساقلاش سىستېمىسى ۋە ماتېرىيال سىستېمىسى قۇرۇلمىسى ۋە تۈرلۈك ساقلاش ۋاقتىنى ئاشۇرۇش. توڭلىتىلغان خېغىرى HPMC نى قوشتى, چمۇش ساقلاش ۋاقتىغا قارىغاندا, CMINECON نىڭ ئېچىلىڭ, 32.48% (توڭلىتىلغان ساقلاش 09.14 (توڭلىتىلغان ساقلاش 0 دە% 0.3.1s (توڭلىتىلغان ساقلاش 0 كۈن). زالىم 60 كۈن), ئېشىش نىسبىتى% 2047 بولدى. قانداقلا بولمىسۇن, 60 كۈنلۈك ساقلاشتىن كېيىن, HpmC نىڭ ئۆسۈشى, CFC نىڭ ئېشىش سۈرئىتىدىن ئاشتى, ئۇنىڭدىن% 18.41,% 13.41,% 13.48). شۇنىڭ بىلەن بىر ۋاقىتتا, HPMC يەنە بىرىنىڭ مىقدارىنىڭ ئېشىشىغا ماس كېلىدۇ, 32.48A-0.32% (IPMC) غا 31.73 ± 0.20%. . يېتىشتۈرۈش چارىسى, قىستۇرغىلى بولىدىغان ھالەتنى ئەسلىگە كەلتۈرۈش جەريانىدا, شۇڭا ئاستا بولگىلى بولمايدىغان سۇنىڭ بىر قىسمى توڭلاتقى بولىدىغان سۇغا ئايلىنىدۇ. قانداقلا بولمىسۇن, HPMC مۇز خرۇستالنىڭ شەكىللىنىشى ۋە ئېشىشىنى ئۈنۈملۈك چەكلىيالايدۇ ھەمدە خېمىر قۇرۇلمىسىنىڭ مۇقىملىقىنى قوغدىيالايدۇ, شۇنىڭ بىلەن توسۇلى بولغان سۇ تەركىبىنىڭ ئېشىشىنى ئۈنۈملۈك چەكلەش. بۇ تېرىنىڭ قانۇنىدىكى يۇمىلاق شەكىللىك ھۆللۈك قانۇنىدىكى قانۇنىغا ماس كېلىدۇ, ئەمما تېرىنىڭ تېخىمۇ چولپاندا بار, CFW قىممىتى ھۆل گىلەم ئۇفورغان (جەدۋەل) قىممىتىدىن كىچىك.
2.3.6 لىموم قوشۇلۇشى ۋە ھورلانغان ناننىڭ سۈپىتى
2.3.6.1 HPMC قوشۇلۇشىنىڭ تەسىرى ۋە پالغۇشنىڭ ھورۇنلۇق ۋاقتى
ھورلانغان ناننىڭ كونكرېت مىقدارى ھورلانغان ناننىڭ كۆرۈنۈشى ۋە سەزگۈسىنىڭ سۈپىتىنى تېخىمۇ ئۆچ ئالالايدۇ. ھور ناننىڭ كونكرېت مىقدارى, ئوخشاش سۈپەتتىكى پار, ئىمزالانغان نان ۋە كونكرېت ئىمتىمنىڭ تاشقى كۆرۈنۈشى تاشقى كۆرۈنۈشى, رەڭ, رەڭ ۋە سۆرەش ۋە سەزگۈنى ساقلاشقا تەسىر كۆرسىتىدۇ. ئومۇمەن قىلىپ ئېيتقاندا, چوڭراق ھورلار بىلەن ھورۇنلار بار ئىستېمالچىلار بىلەن تېخىمۇ كۆپ تەسىرلىك.
IPMC رادىئوسىنىڭ 2.2 نىڭ ئۈنۈمى ۋە يېڭى ھەجىمنىڭ ئالاھىدە مىقدارىنىڭ مۇقەپلەندى
ھورلانغان ناننىڭ كونكرېت مىقدارى ھورلانغان ناننىڭ كۆرۈنۈشى ۋە سەزگۈسىنىڭ سۈپىتىنى تېخىمۇ ئۆچ ئالالايدۇ. ھور ناننىڭ كونكرېت مىقدارى, ئوخشاش سۈپەتتىكى پار, ئىمزالانغان نان ۋە كونكرېت ئىمتىمنىڭ تاشقى كۆرۈنۈشى تاشقى كۆرۈنۈشى, رەڭ, رەڭ ۋە سۆرەش ۋە سەزگۈنى ساقلاشقا تەسىر كۆرسىتىدۇ. ئومۇمەن قىلىپ ئېيتقاندا, چوڭراق ھورلار بىلەن ھورۇنلار بار ئىستېمالچىلار بىلەن تېخىمۇ كۆپ تەسىرلىك.
قانداقلا بولمىسۇن, توڭلىتىلغان خېۋىرىڭدىن ياسالغان پارنىلغان ناننىڭ توڭلىتىلغان ساقلاش ۋاقتىنى ئۇزارتىشنىڭ كونكرېت مىقدارى بىلەن ئازايدى. بۇنىڭ ئىچىدە, توڭلىتىلغان خېمىردىن HPMC نى قوشماي, توڭلىتىلغان ھالقا 2.835 ± 0.064 CM3 / G (توڭلىتىلغان ساقلاش). 0 كۈن) 1.495 ± 0.070 ± 0.070 CM3 / G (تولغاق ساقلاش 60 كۈن) توڭلىتىلغان ھالغىچە, توڭلىتىلغان ھالقانىڭ كونكرېت مىقدارى% 2.1660 ± 0.041 / G دىن 2.160 ± 0.041 cm3 / g. 451 ± 0.033 cm3 / g شۇڭلاشقا, توڭلىتىلغان خېمىر قوشۇلغان ھورلانغان ھوردىنىڭ كونكرېت مىقدارى. ھور ناننىڭ كونكرېت مىقدارىلىرى سېپىل نانلار پائالىيىتى (فېرمېماتىكا گاز ئىشلەپچىقىرىش پائالىيىتى) بولۇپ, ئۇ ئەڭ ئاخىرقى مەھسۇلاتنىڭ كونكرېت مىقدارىغا نىسبەتەن ئوتتۇراھال تەبىئىي گاز چىقىرىش ئىقتىدارى [96'9 نەقىل ئېلىنغان. تومۇردىكى تور قۇرۇشنىڭ نەتىجىسى ئېچىلىپ, خېمىلىك تور قۇرۇلمىسىنىڭ تومۇر, توڭلىتىش دەرىجىسى بۇزۇلغان بولۇپ, توڭلىتىش ۋاقتىنى ئۇزارتىش بىلەن كۈچەيتىلىدۇ. بۇ جەرياندا ئۇنىڭ گاز ساقلاش ئىقتىدارى نامرات, بۇ ئۆز نۆۋىتىدە پارنىسى ناننىڭ كونكرېت مىقدارىنىڭ تۆۋەنلىشىنى كەلتۈرۈپ چىقىرىدۇ. قانداقلا بولمىسۇن, HPMC نىڭ ھاۋا تەڭشىگۈچنىڭ قوشۇمچە ھوقۇقىنى تېخىمۇ ياخشى قوغدىالايدۇ, شۇنداق بولغاندا O. HTo C. Lup نىڭ 60-قېتىم ئۆسۈشى تېخىمۇ ياخشى, مۇناسىپ چۈشنىڭ كونكرېت مىقدارى تەدرىجىي تۆۋەنلەيدۇ.
2.3.6.2 HPMC قوشۇلۇش نىسبىتى ۋە تولغان ناننىڭ پۇرىقى
TPA (سالامەتلىك ئالاقە تەھلىللىرى) فىزىكىلىق مۈلۈك تەكشۈرتۈش, ئېكىسپورتى, كاتتالىق, قىرغىنچىلىق, چايناش, ئېغىزۇش يېمەكلىكلىرىنىڭ مېخانىكىلىق مۈلكى ۋە ساغلاملىقىنى ئومۇميۈزلۈك ئەكىرىشنى تىزىشقا ئىقتىدارلىق دەلىللىەلەيدۇ. 2.3-رەسىم HPMC قوشۇشنىڭ ئۈنۈمىنى كۆرسىتىپ بېرىدۇ, HPMC قوشۇشنىڭ ئۈنۈمىنى كۆرسىتىپ بېرىدۇ ۋە ھورلانغان بولكىنىڭ قاتتىقلىقى توغرىسىدىكى ئۈنۈملەرنى كۆرسىتىپ بېرىدۇ. نەتىجىدە كۆرسىتىلىشچە, HPMC دىن ئېشىپ كەتمەي, HPMC دىن ئېشىپ كەتتى, ھورلار كۆپ ھەسەتخورلۇق تەس. 355.555 ± 246.55 (قۇرۇق ئەۋرىشكى) دىن 310.44 ± 20.06 ± 20.06 ± 12.29 G (215.29 G (% 2 hpmc قوشۇلدى). بۇ ھورلانغان ناننىڭ كونكرېت مىقدارىنىڭ ئېشىشىغا مۇناسىۋەتلىك بولۇشى مۇمكىن. ئۇنىڭدىن باشقا, 24-رەسىمدىن قارىغاندا كۆرۈنىدىغان يۇقىرىلاردا, HPMC قوشۇلغان ئۆسۈش سوممىسىنىڭ كۆپىيىشىدە, يېڭى خېمىردىن ياسالغان پارنىسىيە% 0.968 (قۇرۇقلۇق) ئايرىم-ئايرىم ھالدا 0.96 (قۇرۇقلۇق). .02020 ± 0.004 (% 0.54 (% 1.006 ± 0.06 (% 1.00) ۋە 1.176 ± 0.03 (% 2.003 ±). پارنىش ۋە سالامەتلىكىنىڭ ئۆزگىرىشى HPMC نىڭ قوشۇلۇشى HPMC نىڭ نۇقسانسىز بولكىنى ئۆستۈرىدىكەن. بۇ rosjas, بېۋايتې دېگۈچ (2001] [95] [95] [95] [95] [95] [95] [95] [95] [95] [95] [95] [95] [95] [95] [onsms] [HPMC] [HPMC] [HPMC] [HPMC] دىن بىردەك, يەنى HPMC] دىن بىردەكلا كۆرۈنەرلىك تۆۋەنلىتىدۇ.
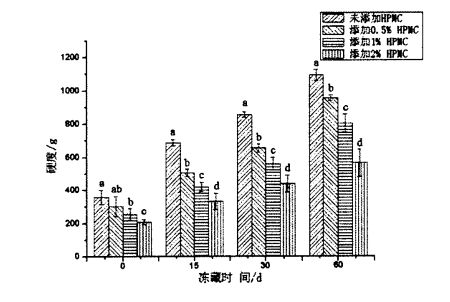
2-رەسىم HPMC قوشۇشنىڭ ئالدىنى ئېلىش ۋە خەنزۇچە ھورلانغان بولقىشنىڭ قاتتىقلىقى
يەنە بىر تەرەپتىن, توڭلىتىلغان خېمىر, ئۇ خېلى توڭلىتىش ۋاقتىنى كەلتۈرۈپ چىقىرىدىغان توڭلىمە ساقلاش ۋاقتى كۆرۈنەرلىك جاپالىق (0.0.05), ئېلفورختلىق يۈز بەرگەندە كۆرۈنەرلىك (p <0.05). قانداقلا بولمىسۇن, توڭلىتىلغان خېۋەنىڭ ھورلۇق ھەيڭى HPMC نىڭ HPMN نىڭ تەسلىكى 358.267 ± 42.167 ± 47.167 ± 37.15.01 دىن 1092.018 دىن 1092.014
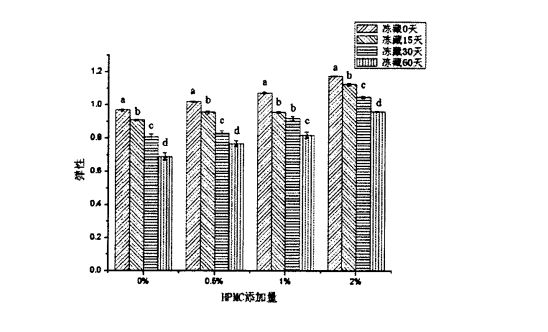
توڭلىتىلغان خېمىرى توڭلغان پار, ياسالغان پار,% HPMC بىلەن% 2 hpmc دىن ئېشىپ كەتتى 208.233 ± 15.566 g (توڭلىتىلغان ساقلاش 0 كۈن) دىن 564.848 ± 60 كۈنلۈك (توڭلىتىلغان ساقلاش 60 كۈن). HPMC قوشۇلۇشىدىكى 24-رەسىم ۋە ئېلخەتكە تەڭشەڭنىڭ باھانى چۈشۈشتىن بۇرۇنقى خېمىرتۇرۇچنىڭ تەسىرىدىن 0.968 (0 مىليوندىن تۆۋەن نان) دىن 0.689 ± 0.022 (60-يىلغا بارغاندا, 20.022) % HPMC بىلەن توڭلىتىلغان ھورلانغان پاركۇسلارنىڭ ئېلاستىنىڭ ئاستا-ئاستا ئېغىشى 1.176 ± 0.003 دىن تۆۋەنلىدى (0.962 ± 0.003 (60 كۈنگە توڭدى). ئېنىقكى, توڭلىتىلغان ساقلاش مۇددىتى ئىچىدە توڭلىتىلغان خېمىرنىڭ ئۆزگىرىشى بىلەن تۆۋەنلەيدۇ. بۇ خىلتىكى HPMC نىڭ خەۋىرىگە قارىغاندا, HPMC نىڭ خەۋىرى: HPMC نىڭ كەمچىلىكى بىر ناننىڭ سۈپىتىنى ئۈنۈملۈك ياخشىلاپ چىقالايدۇ. ئۇنىڭدىن باشقا, 2.5 جەدۋەل HPMC دىن باشقا, باشقا تېكىستلىك بولكىنىڭ توڭلىتىلغان ساقلاش ۋاقتى توغرىسىدىكى ئېھتىياجنى تۆۋەنلىتىدۇ. ) كۆرۈنەرلىك ئۆزگىرىش يوق (P> 0.05); قانداقلا بولمىسۇن, توڭلىتىشنىڭ قانچە كۈنى, HPMC دىن ئۆسۈشى, سوۋۇتۇش ۋە چايناش كۆرۈنەرلىك (p
يەنە بىر تەرەپتىن, يېقىشلىق ۋاقىتنى ئۇزارتىش ۋە ھاش يۈزلىنىش ۋە ئەسلىگە كەلتۈرۈش كۈچى كۆرۈنەرلىك تۆۋەنلىگەندىن كۆرۈنەرلىك. HPMC نى قوشماي تۇرۇپ, HPMC نى قوشماي تۇرۇپ, پورلانغان بولكا سەۋەبىدىن ياسالغان بۇ پارتلىغان نانلار) 0.49 + 0.06 g (توڭلىتىلغان ساقلاش كۈچى 0.04) 60 كۈن قالدى. قانداقلا بولمىسۇن, توڭلىتىلغان خېۋە توڭدىن ياسالغان پارستىن 2 ھەسسە ئېشىپ, ئۇستاز) 0.93 + 0.03 g (توڭلىتىش كۈچى 60 كۈن) تۆۋەنلەپ 0.27 + 0.01 (توڭلىتىلغان ساقلاش كۈچى 0.07 + 4.01 (توڭلىتىلغان ساقلاش كۈچى 60 كۈنگىچە تۆۋەنلىدى, بۇ ئەسلىگە كەلتۈرۈش كۈچى 0.27 + 9.01) دىن تۆۋەنلىدى. بۇنىڭدىن باشقا, پارنىكۈزلۈك ساقلاش ۋاقتىنى پەيدا قىلىپ, ھورلانغان ناننى كۆرۈنەرلىك ئاشۇرۇش بىلەن كۆرۈنەرلىك ئاشتى. بوياق HPMC نى قوشماي تۇرۇپ, پارتلىغان خېمىرى توپا تۈگىدى, 37-نومۇرلۇق. 24 (سۈزۈلگەن 0 كۈنلۈك ساقلاش) نىڭ باھاسى 1232.87 (توڭلاتقۇ ساقلاش), توڭلىتىلغان 135.76 + 83.94 + 83.95 (ئەتىگەنلىك قانداقلا بولمىسۇن, توڭلىتىلغان خېۋە توڭلىتىلغان خېۋە توڭلىتىلغان پارستىن% 2 hpmc يەنە% 2 hpmc يەنە% 2 hpmc يەنە% 20.62 + 1 1.84 + 1 1.84 دىن ئەلالاش. 96 + 45.58 (توڭلىتىش ۋاقتى 60 كۈنلۈك), تۇڭراقتا 200.21 + 10.21 (STARZEN ساقلاش ۋاقتى 404.26 (STAZNUGE CHARE 60 كۈن). بۇ ۋاقىتتا HPMC نىڭ قوشۇلۇشى توڭلىتىش ئارقىلىق كېلىپ چىققان پارتلاش خالتىرلىقىدىكى ئۆزگىرىشلەرنى ئۈنۈملۈك چەكلەش ئۈچۈن. ئۇنىڭدىن باشقا, مۇزلاپ كەتكەن ساقلاش بوشلۇقىدىن كېلىپ چىققان پارنىلىسلىك تۇراقلىق ناننىڭ ئۆزگىرىشى (قاراقچى ۋە ئولتۇرۇشنىڭ كۆپىيىشىگە ئوخشاش) ۋە ئەسلىگە كېلىشنىڭ تۆۋەنلىشىمۇ بولۇپ, پارتلانغان بولاقلىق كونكرېت ھەجىمىمۇ ئىچكى باغۋەن. شۇنداق قىلىپ, دۆتلىك خانلىقلار (retrypaltysion جەرياننى قوشۇش, توڭلىمە پەيدا بولۇش, توڭلىتىلغان خېمىر ۋە پىچاقنى پىششىقلاپ ئىشلەنگەن پارس قوليۇتى مۇكەممەللەشتۈرۈلىدۇ.
2.4 باب
Hydroyprowyl Methylullouse (HPMC) بىر خىل گىتروفىللىق كولول كولوئىد بولۇپ, ئاخىرقى خىل مەھسۇلات يەنىلا كەمچىل. بۇ تەتقىقاتنىڭ ئاساسلىق مەقسىتى توڭلىتىلغان خېفر ۋە پومشۇنلۇق خۇسۇسىيىتىنى ياخشىلاش رولىنى تەكشۈرۈشنىڭ ئۈنۈمى ياخشىلىنىشىنى, شۇڭا HPMC نىڭ نان ۋە جۇڭگو ئۇسلۇبىدىكى ئۇن مەھسۇلاتلىرى بىلەن HPMC نىڭ ئۈنۈمىنى تەمىنلەشكە ئىگە. نەتىجىدە كۆرسىتىلىشىچە, HPMC نىڭ خېفېرنىڭ قۇتقۇزۇش خاراكتېرلىك مۈلكىنى ياخشىلىيالايدۇ. VPMC نىڭ ۋاقتى% 2 بولسا, كونترول بالدىقىنىڭ% 2) سۈمۈرۈلۈشى% 58.10 كە ئۆرلەيدۇ. 2 مىنۇت 12.2 مىنۇت شۇنىڭ بىلەن بىر ۋاقىتتا, خېمىل شەكىللىك ۋاقىتنىڭ كونترول گۇرۇپپىسىدا 2.1 مىنۇتتىن تۆۋەنلىگەن .5 مىليونغا يەتتى. ئاجىز دەرىجىدىكى ئاجىز دەرىجىدىن 55 فۇدىن 18 فۇغىچە ئازايدى. بۇنىڭدىن باشقا, HPMC يەنە خېمىرنىڭ بىر رىغبەت خاسلىقىنى ئۆستۈردى. HPMC نىڭ كۆپىيىشىگە ئەگىشىپ, خېمىرنىڭ ئۇزارتى كۆرۈنەرلىك ئاشتى. كۆرۈنەرلىك ئازايتىلدى. بۇنىڭدىن باشقا, مۇزيېكتورنىڭ يۈز سۆزىدە ئۈزۈنۈش ۋاقتىدا, خېفرىي تور قۇرۇلمىسىنىڭ كۆپىيىشىنى تۆۋەنلىتىدۇ, ئۇ يەنە بىر تور قۇرۇلمىسىنىڭ يۈز بېرىلىكىنى قوغدايدۇ, خېمىر تورىنىڭ مۇقىملىقى, خېمىر تورى قۇرۇلمىسىنىڭ مۇقىملىقىنى ئىگىلەيدۇ. ئاخىرقى مەھسۇلاتنىڭ سۈپىتى كاپالەتلەندۈرۈلدى.
يەنە بىر تەرەپتىن, تەجرىبە نەتىجىسى, HPMC نىڭ قوشۇلغانلىقىنى كۆرسىتىپ بېرىدۇكى, توڭلىتىلغان خېمىرىدىن ياسالغان پارنىمۇ ياخشى كونترول قىلىش تەسىرى بار. UNFROZEFS ئۈچۈن, NPMC نىڭ نان ناننىڭ كونكرېت مىقدارىنى كۆپىيىپ, ئېلانىنىڭ توكىرىنى كۈچەيتتى, شۇنىڭ بىلەن بىر ۋاقىتتا ھورلانغان بولاقنىڭ قان ۋەز -لىقىنى ئاشكارىلىدى. ئۇنىڭدىن باشقا, HPMC نىڭ توڭلىتىلغان زەربەنىڭ سۈپىتىنى ئۇزارتىش سۈپىتى بىلەن سۇنۇپ كەتكەن يۇلتۇزلارنىڭ ناچارلىشىشىغا, يېپىشقاق بولۇش, كۋادرات ۋە ئەسلىگە كەلتۈرۈش كۈچىنىڭ ئېلەۋىسىنى تارقىتىدىكەن.
خۇلاسە دە, بۇ ۋاقىتتا Shamed Bl نى بىر تەرەپ قىلىش ۋە گۈللەندۈرۈشنىڭ تېخىمۇ ياخشى ساقلاشنى ۋە مۇكەممەللەشتۈرۈش ئۈنۈمى بار.
3-باب HPMC نىڭ يوپۇرماقلىق شارائىتتا بۇرمىلىنىش ۋە خۇسۇسىيەتكە ئۇچرىشىنىڭ تەسىرى
3.1 تونۇشتۇرۇش
بۇغداي گلۇتېن بۇغداي تېرىكتىكى ئەڭ كۆپلۈك ساقلاش ئاقسىللىقى, ئومۇمىي ئاقسىلنىڭ% 80 تىن كۆپرەكىنى ئىگىلىدى. زاپچاسلىرىنىڭ ئەمەلگە ئاشۇرۇشىغا سانلىق مىللەت بولسا, ئۇ گۇلۇنمىن (ئەلكاۋىدىن ھەل قىلغىلى بولىدۇ) ۋە گوللاندىيەدە ئېرىمەڭ (ئەلكالېننىڭ ھەل قىلىش چارىسى). ئېتانول ئېرىتمىسىدە). بۇنىڭ ئىچىدە مولېكۇلا ئېغىرلىقى (MW MW) 1x10⁷jA غا ئوخشاش يۇقىرى. ھەمدە ئۇنىڭدا تارماقچىسى ۋە ئوكۇلمول خاراكتېرلىك دېلونى شەكىللەندۈرەلەيدۇ. گالىدىنىڭ مولېكۇلاسىنىڭ يېرىمىلا 1x10⁴da, بۇ يەردە پەقەت بىرلا سۇلىق بار, بۇ يەردە مولېكۇلالارنى ئىچكى دېلەۋەت قىلالايدۇ [100]. خېفېت, سەھش, خېف (1 996) خېمىر (سەككىزىنچى) ئارىلىقتا تارقىتىش) ۋە ئاقسىل جەمئىيىتى (خېف تور قۇرۇلمىسىنىڭ شەكىللىنىشى). ئادەتتە يۆتكەلگەندە, گلۇۋىرنىي خېمىننىڭ زالىنىڭ سالامەتلىكچانلىقى ۋە قۇرۇلمىنىڭ كۈچلۈكلۈكىنى بەلگىلەيدۇ, شۇنىڭ بىلەن خېلى روھنىڭ سىڭىپلاش ۋە سۇيۇقلانىنى بەلگىلەيدۇ [102]. GLUD ئاقسىلنىڭ ياردىمىدە شەكىللەنگەن ۋە خېمىر دەرىخى, خېمىروناشلار, خېمىرەت, ئېكسكۋا پارلىمى ۋە سۇ سۈملىشىش قاتارلىقلارنى كۆرسىتىدۇ.
ئۇنىڭدىن باشقا, بىر ئوكياننىڭ ئارىلىقىنىڭ تۆۋەنلىشىگە ئەگىشىپ, يەككە ئۆلچەملىك تور قۇرۇلمىسىنىڭ شەكلىگە ئەگىشىپ, بىر تەرەپ قىلىش زايومىپىات (پىشروگېن زايومى قاتارلىق كەڭ زايوم ([103] [103] [103] [103] [103] [103]. گەرچە ئىككىنچى بومبىنىڭ ئېنېرگىيىسى
مىلتىق ۋە مۇقىملىق ئالەم زايوملاردىن ئاجىز, ئەمما ئۇلار گولۇننىڭ كېلىشىمىنى قوغداش مۇھىم رول ئوينايدۇ.
توڭلىتىلغان خېمۇز, توڭلىتىش شارائىتى, تىركىرىياتسىيەلىنىش ۋە قايتاخېتىش جەريانى) نىڭ جىسمانىي تور قۇرۇلمىسىنىڭ جىنىسلىق جەھەتتىن ئېكرانىنى كەلتۈرۈپ چىقىرىدۇ, ئۇنىڭ قۇرۇلمىقىدىكى پۈتۈن دېلونى ۋەيران قىلىدۇ, مىكروسكوپ ھالاك بولىدۇ. گلۇتېن ئاقسىلنىڭ قۇرۇلمىسى ۋە خۇسۇسىيىتىگە ماس كېلىدۇ [105'1061. خۇگو, et A1. (2012) گاڭگىراشنىڭ ئۇزاقلانغان ۋاقىتتىن, مولېكۇلالىق ئېغىرلىقى ۋە مولېكۇلا تۇغۇلدى, مولېكۇلالىق ساغلاملىق مىقدارى تۆۋەنلەپ كەتتى [107جدە ئۇ كىلۇت ئاقسىللىق قىسمەن ھوقۇقلۇقلىقى ئاشكارىلاندى. بۇنىڭدىن باشقا, گلۇتېن ئاقسىلنىڭ ئۆزگىرىشى ۋە تېرمودىنامىكىلىق خۇسۇسىيەتلىرى يېمېندىنامىيابلىق خۇسۇسىيەت ۋە مەھسۇلات سۈپىتىگە تەسىر كۆرسىتىدۇ. شۇڭلاشقا, مۇز تەڭشەش جەريانىدا, سۇ شىتاتىنىڭ ئۆزگىرىشىنى تەكشۈرۈشنىڭ ئالاھىدە مەنىسى) ئوخشىمىغان توڭلىماقتا ساقلاش ۋاقىت ئەھۋالى ئاستىدا.
سېللېلوزاتېنىڭ تۇرىئېل قېپىدا تىلغا ئېلىنغاندەك, Sydroyprollyl Methylcellupplel MethylcellulloseLyL Methylcellupplel MethylcelluppleL Methylcellupplel MethylcelluppleL Methylcellupplel MethylcelluppleL MethylcelluppleL MethylcelluloseLse (HPMCC) توڭلىتى توڭلىتىش بىر يىل ئوقۇشقا ئەمەس, ئۇنىڭ ھەرىكەت مېخانىزمىلىرىمۇ تۆۋەن.
شۇڭلاشقا, بۇ تەجرىبە مەقسىتىدە, تەتقىقات ئەندىزىسىنى ئۆلچەپ, HPUT قىزىل مېيىگە كىرىپ, HLuten ئاقىلانە ساقلاش ۋاقتىنى, تېرمودىنامىيبىي مال-مۈلۈك ۋە ئۇنىڭ فىزىكا تاياقلىق خاسلىقى, ئاندىن پۈتۈشكەن بىر تەرەپ قىلىش مۈلكى, ئاندىن HPMC مېخانىزمىنىڭ ئۆزگىرىشى ۋە HPMC مېخانىز مەسىلىسىنىڭ سەۋەبىنى كۆرسىتىپ, مۇناسىۋەتلىك مەسىلىلەرنى چۈشىنىشنى ئۆستتۇرىدۇ.
3.2 ماتېرىيال ۋە ئۇسۇل
3.2.1 تەجرىبە ماتېرىياللىرى
Gluten ئەنخۇي رۇي فۇ Xu Xu xu xu xuo co., ltd. HydroxyPripyL Mythylcellulose (HPMC بىلەن ئوخشاش) ئالدانكىن خىمىيىلىك داۋالاش چەكلىك شىركىتى
3.2.2 تەجرىبە زاۋۇتى
ئۈسكۈنە ئىسمى
بايقاش. R3 rheometer
Dsc. Q200 پەرقلىق سىكانىرلاش ئىسسىقلىق ئۆيى
PQ00 1 تۆۋەن ساھە NMR ئەسۋابى
722E سپېكتروتومېتىر
JSM. 6490LV تۇڭستاڭ Firefation سىكانېرلاش ئېلېكترونلۇق مىكروسكوپ
Hh رەقەملىك تۇراقلىق تېمپېراتۇرا سۇ مۇنچىسى
BC / BD. 272 مەبلەغ توڭلاتقۇ
Bcd. 201Lect توڭلاتقۇ
مەن. 5 Ultra-microyperronic تەڭپۇڭلۇقى
ئاپتوماتىك مىكروگېر ئوقۇرمەن
نىكوللېت 67 ياللۇغى ئارال قىلىنغان سپېكترومېرنى ئۆزگەرتىدۇ
Fd. 1b. 50 ۋاكۇئۇمنى توڭلىتىدۇ
KDC. 160 سائەت يۇقىرى سۈرئەتلىك توڭلاتقۇنىڭ مەركىزى
Thermo Fisher FC تولۇق دولقۇن ساياھىتىنى سايىلەش مىكروبېر ئوقۇرمەن
Pb. Model 10 ph meter
Myp ll. 2-ماگنىتلىق قوزغىتىش
Mx. S تىپىدىكى Eddy ھازىرقى تەۋرىنىش
SX2.40.10 مۇپكە يەتتى
KjelleteC TM 8400 ئاپتوماتىك كىيگەنلىك Vitrogen ئانالىزچىسى
ئىشلەپچىقارغۇچى
ئامېرىكا TA شىركىتى
ئامېرىكا TA شىركىتى
شاڭخەي Nifeht شىركىتى
شاڭخەي Specum CERMEMENTER CO., LTD.
ئەمچەكلەر ئېلېكترون مەھسۇلاتلىرى CO., LTD.
جىنتان جىنخېڭ گوۋاچېڭ تەجرىبە زاۋۇتى
چىڭداۋ Hier گۇرۇپپىسى
Hefei mei ling co., ltd.
Sartorius, گېرمانىيە
تېرمو بېلىقچى, ئامېرىكا
Thermo Nicklet, ئامېرىكا
بېيجىڭ بويۇم بوڭ تەجرىبە ئەسكىرى چەكلىك شىركىتى.
ئەنخۇي جوڭ كەي جياڭ جيياڭ ئىلمىي ئەسۋاب چەكلىك شىركىتى چەكلىك.
تېرمو بېلىقچى, ئامېرىكا
Freroris Grower
شاڭخەي Mei Ying Pu Carde Com, LTD.
SCALGEX, ئامېرىكا
خۇاڭتا ئۇ تېبفېڭ تېببىي ئۈسكۈنىلەر چەكلىك شىركىتى.
دانىش تاشقا
3.2.3 تەجرىبە قايتا-قايتا
سىناقتا ئىشلىتىلگەن بارلىق خىمىيىلىك ئىجارە ئالغۇچىلار ئانالىز دەرىخى ئىدى.
3.2.4 تەجرىبە ئۇسۇلى
3.2.4.1 گۋاتېننىڭ ئاساسىي تەركىبلىرىنى بەلگىلەش
GB 5009.5010, GB 50093.2010, GB 50094.2010, Gb / Tiiseniange in 5003tain78-81], ئاقلىما نەملىك, ئاشۇر ياكى ليامۇلىنىڭ ماددىلىرى ئايرىم-ئايرىم ھالدا بېكىتىلگەنلىكى ۋە نەتىجىدە نەتىجىدە رول ئوينايدۇ.
3.2.4.2 توڭلىتىلغان ھۆل گلۇتېن خېۋىي (گلۇتېن خېمىر)
ئېغىرلىقى 100 گرام گۋاتېن ماسسىسى. ئېلىپ ئاندىن ئېلىپ, ئۇنى يېڭى ساقلاش خوراز ئورنىتىڭ, ئۇنى يېڭى ساقلاش خوراز ئورنىتىڭ, ئاندىن ئۇنى يېڭى ساقلاش خوراز ئورنىتىڭ, ئاندىن ئۇنى 4-نومۇرلۇق .30 at. 48 ℃ .18 ℃ for مەلۇم مۇددەت (15 كۈن ۋە 60 كۈن). توڭلىتىلغان 0 كۈنلۈك ئەۋرىشكىسىنى ۋە باشقا ئىشلەپچىقىرىش قەدەملىرى ۋە توڭلىتىش قەدەملىرى ئۆزگەرمەيدۇ, شۇڭا% 0.5 نى ئۆزگەرمەيدۇ, شۇڭا ھۆل تەمرەت يېتىشتۈرۈش ئەۋرىشكىسىنى پەرقلەندۈرۈش ئۈچۈن HPMC قوشۇش.
3.2.4.3 ھۆل گۋاتېن ماسسىسىنىڭ رىلوتولوگىيە خۇلاسىسىنى بېكىتىش
مۇناسىپ مۇزلاپ مېڭىش ۋاقتى ئاخىرلاشقاندا, توڭلىتىلغان ھۆل گللۇېن ماسسىسىنى چىقىرىپ, ئۇنى 4 سائەتلىك قاتناش توڭلاتقۇغا قويۇڭ. ئاندىن ئۈلگە پۈتۈنلەي ئېرىلىپ, ئۆينىڭ تېجىنىكىدا چىڭ قويۇڭ (بۇ خىل يېقىشلىق يېكىل ماسسىنى تالۋاسنىمۇ تەكشۈرۈشنىڭ بىر قىسمى, 2.7.1 ۋە 2.9.1 ۋە 2.7.1 ۋە 2.9). ئېرىتىلگەن ھۆل گللۇت كۆلىمىنىڭ مەركىزى رايونىنىڭ ئەۋرىشكىسى (تەخمىنەن 2 گ) ئۈزۈلۈپ قالدى. ستاتىستىكا سۈپۈرۈلگەن) سىزىقلىق VISP) نى تۆۋەندىكىدەك قىلىپ, كونكرېت تەجرىبە پاراشوكى 40 مىلكە ئۈلگە بولۇپ, بۇ بوشلۇق 40 مىلكە تەڭشەلگەن بولۇپ, بۇ بوشلۇق 1000 MRN غا تەڭشەلگەن, جىددىيلىك سۈزۈش دائىرىسى% 0.01. 100%, چاستوتىسى 1 Hz غا تەڭشەلدى. ئاندىن ئەۋرىشكىنى ئۆزگەرتىتىلگەندىن كېيىن, 10 مىنۇت تۇرايلى, ئاندىن ھەرىكەتچان
چاستوغىلاش سۈپۈرۈلۈڭ, كونكرېت تەجرىبە پارامېتىرلىرى تۆۋەندىكىچە, كونكرېت سىناق پارامېتىرلىرى - ئۈزلۈكسىز% 0.5 لىك (LVR), چاستوغلىق سۈپۈرۈش دائىرىسى 0.1 HZ. 10 Hz, باشقا پارامېتىرلار جىددىيلىك سۈپۈرگەن پارامېتىرلار بىلەن ئوخشاش. Sharinging سانلىق مەلۇماتلىرى رامكا شەكلى ۋە 5 سانلىق مەلۇمات (كۆرسەتكۈچ) گە ئېرىشكەن, شۇڭا Encisea ساقلاشقا ئېرىشىش ئۈچۈن چاۋاقەگە ئېرىشىش ئۈچۈن خاتىرىلەنگەن, ساقلاش لايىھىلىگۈچىسى (G ') بېكىتكەندە. دىققەت قىلىشقا ئەرزىيدىغىنى شۇكى, ھەر قېتىم ئەۋرىشكە ھامىللار تەرىپىدىن قىستۇرۇلغاندىن كېيىن, ئارتۇق ئەۋرىشكە تىغ توغرا رەتكە بولىدۇ, بىر قەۋەت بىر قەۋەت مېۋىسى ئەۋرىشكە ئىشلىتىلىدۇ. زىيان. ھەر بىر ئەۋرىشكە ئۈچ قېتىم كۆپەيتىلدى.
3.2.4.4 تېرمېنسىيەلىك مۈلۈكنى بەلگىلەيدۇ
بوتكىنىڭ ئۇسۇلى بويىچە (2003) [1081, ئالاھىدە سۈزگۈچ بالونۇھى (DSC Q.200) ئىشلىتىلگەن, ئەۋرىشكىلەرنىڭ مۇناسىۋەتلىك تېرمودىنامىكىلىق خاسلىقىنى ئۆلچەپ كەتكەن.
.
ھۆل گلۇتېننىڭ 15 مىللىگىسى ئېغىرلىقى ئېغىر ۋە ئاليۇمىنغا كرېستكە مىخلاندى ۋە ئاليۇمىن (سۇيۇق ئەۋرىشكە ماس كېلىدۇ). بېكىشات تەرتىپى ۋە پارامېتىرلار تۆۋەندىكىچە: 5 مىنۇتتا تېمپېراتۇرا (N2 CL C) نىڭ باھاسى 25 كىلوگرام (N2) نى تۆۋەنلىتىڭلار, ئاخىرى 25 مىنۇتتا 25 كىلومىتىر كېلىدۇ, ئاخىرىدا پېچەت پېچەتلەنگەن ئالدامچىلىق ئىدى. سېتىشتا DSC ئەگرى سىزىق 200 رۇپىيە يۇمشاق دېتالىنى سىنۇس كۆرگەزمىنى ئايلىنىش ئانالىزىدىن 2008-يىلىنىڭ 0 ° C قاتارلىق تەھلىل قىلىنغان. مۇز خرۇستالنىڭ ئېرىتى كىرىستەسلىك (YU كۈنى). ئاندىن, يۇقۇملىنىدىغان سۇ مەزمۇنى (CFW) تۆۋەندىكى فورمۇلا تەرىپىدىن ھېسابلىنىدۇ [85-86]:
بۇنىڭ ئىچىدە ئۈچ, نەملىكنىڭ يوشۇرۇن ئايروپىلانىغا ۋەكىللىك قىلىدۇ, ئۇنىڭ قىممىتى 334 JI / g. MC ھۆل گۋاتېننىڭ ئومۇمىي نەملىكىنىڭ ئومۇمىي نەملىكى (GB 50093.2010.2010). 78]. ھەر بىر ئەۋرىشكە ئۈچ قېتىم كۆپەيتىلدى.
(2) بۇغداي يېتىشىنىڭ تېمپېراتۇرا چوققىسى (TP) نىڭ تېمپېراتۇرا (TP) تۈزۈلۈشى
توڭلاپ ساقلاش ئەۋرىتىنى توڭلاپ كېتىپ, ئۇنى يەنە ئېزىتىپ, ئۇنى قايتا تارتىپ, چىلۇپ ئاقسىل تالقىنىغا ئېرىشىش (بۇ قاتتىق پاراشوك ئۈلگىسىمۇ 2.8). بىر 10 مىللىم گلۇ گلۇكان ئاقسىل ئەۋرىشكىسى ئېغىرلاشتى ۋە ئاليۇمىنملىق كرېستكە مىخلانغان (قاتتىق ئەۋرىشكە ئۈچۈن) پېچەتلىدى. DSC ئۆلۈش پارامېتىرلىرى تۆۋەندىكىچە, 20 ~ CN قا پەقەت 20 پېچەتلەنگەن قۇرۇق ھالقىلارنى ئىشلىتىشنى ئىشلىتىش ۋە تەھلىل يۇمشاق دېتالىنى 2000 ئىشلىتىپ, ئېرىشكەن DSC ئەگرى سىزىقنى ئىشلىتىپ, بۇغداق يېشىۋىل ئاقسىلنىڭ نورمال چېكىگە ئېرىشىش (ھەئە) نىڭ چوققا چوڭىيىشىغا ئېرىشىش (ھەئە). ھەر بىر ئەۋرىشكە ئۈچ قېتىم كۆپەيتىلگەن.
3.2.4.5 بۇغداي گۇلفراتنىڭ مەزمۇنى (c)
ئەركىن سۇلف سەللە گۇرۇپپىسىنىڭ مەزمۇنى مەزمۇنى بولسا BeverIdg, باتارىيە ۋە راكاينىڭ ئۇسۇلىنى ئۇسۇلىنىڭ ئۇسۇلىغا ئاساسەن بېكىتىلگەنلىكىنى بەلگىلىدى. ئېغىرلىقى 40 مىللىمدىكى بۇغداي گولۋنېن ئاقسىل ئەۋرىشكىسى, ئۇنى قۇلۇپلاڭ, ياخشى سىلكىڭ ۋە ئۇنى 4 MLECELLL Sulfonate دا تارقاقلاشتۇرۇڭ
ناترىي ناترىي (). Tris-hydroxymethyl AminoMethane (tris). Glycine (gly). TGEINE (EDTA) بۇففېر (Tris) بۇففېر (Tris) b, 1.0 لىك GR لىق, 1% SH لار تەييارلانغان) يۇقىرىدىكى 10 مىنۇتتا, ھەر 10 مىنۇتتا چاپلانغان. ئاندىن, ئۇكىچە, ھەر 10 مىنۇتتا. 1 ° c ۋە 5000 × g 25 ℃ سۇ مۇنچىسىدا مەبلەغ سېلىشنى قوشۇش, 442 NM نى سۈمۈرۈپ, يۇقارقى تۆھپىلەر قۇرۇق كونترول ئىشلىتىلگەن. ئاخىرىدا, ھەقسىز sulfhydryl مەزمۇنى تۆۋەندىكى فورمۇلا بويىچە ھېسابلانغان:
بۇنىڭ ئىچىدە 73.53 بولسا يوقىتىش كوئاپاۋاسلىقى بارلار A سۈمۈرۈلۈش قىممىتى D سۇيۇق ھالەت ئامىلى (بۇ يەردە 1) G ئاقسىل مەركەزلىشىشى. ھەر بىر ئەۋرىشكە ئۈچ قېتىم كۆپەيتىلدى.
3.2.4.6 نى بەلگىلەش 1h مەن «2 ئارام ئېلىش ۋاقتى
Kontogiorgos غا ئاساسلانغاندا, گوفايس ۋە كاساسس 0.43 تال, رېئوننا چەمبىرىكى 18.169. تومۇر تەرتىپلىرى كارنى-purpol-meiboom-meiboom (100 دىن ئايرىم-ئايرىم ھالدا 13 ^ ۋە 25 ى ئىشلىتىلگەن ۋە تومۇر ئارىلىقى ئاخىرلىشىش مىقدارىنىڭ ئارىلىشىشىنى ئازايتىدۇ. بۇ سىناقتا, ئۇ O. 5 M S غا تەڭشەلدى. ھەر بىر گەيتىس 8 قېتىم سىكانىرنى سىكانىرلاپ, سىگنالنىڭ (SNR) نى ئاشۇرۇش ئۈچۈن سىگنالنىڭ (SNR) نى ئاشۇرۇش ئۈچۈن 8 قېتىم سىكانىرلىدى. ئارام ئېلىش ۋاقتى تۆۋەندىكى بىر قاتار تەڭلىمەدىن ئېرىشىدۇ:
بۇنىڭ ئىچىدە m تەكشۈرۈشتە ۋاقىت جەدۋىلىگە ئايلانغان بەلگە ئېقىشىنىڭ راك بەلگىسى بولغان روكنىسلىق سوممىسىنىڭ ئىقتىدارى. ياڭ) ئازادە يوللانما (D) بومبىسى (D) دېگۈدەك ئارام ئېلىش ۋاقتى (d) بىلەن مۇستەقىل ئۆزگىرىشچان.
كاشىلا كۆرۈلگەن ئانالىزى يۇمشاق دېتالىدىكى «ئۈزلۈكسىز ئۆزگىرىشتىن تاشقىرى ئۆزگەرتىشنى ئىشلىتىش, ھالقىلىق ھالقىما رەتسىزلىك ئەگرىسىگە ئېرىشىش ئۈچۈن ئېلىپ بېرىلغان. ھەر بىر ئەۋرىشكە ئۈچ قېتىم تەكرارلاندى
3.2.7, بۇغگۇر گولۋېن ئاقسىلنىڭ ئوتتۇرا قۇرۇلمىسى بەردى
بۇ تەجرىبىلەردە ئاۋازلىق يەككە بىر ئەكس ئەتتۈرىدىغان ئومۇمىي تەپەككۇرت (ATR) قوشۇمچە زاپچاسلىرى GLU. شىركىتىنىڭ ئىككىلەمگى قۇرۇلمىسى ۋە كادمىينىڭ داۋۇتنى تەكشۈرۈش سۈپىتىدە ئىشلىتىلگەن. ھەر ئىككى ئەۋرىشكە ۋە تەگلىك يىغىش, ھەر ئىككىسى 4 CM ~ ۋە سىكانېرلاش دائىرىسى 4000 CMQ-500 CM ~. ATR ماس كېلىدىغان ئالماسنىڭ يەر يۈزىدىكى ئاز مىقداردا ئاقلانغان ئاقسىل قاتتىق قۇۋۋەت, سىز سائەت 3 بۇرۇلۇپ, ئەۋرىشكەنىڭ ئىشەنچىسىدىن ئېشىپ كېتىشى ۋە ئاخىرى ۋارىسلىق گەپلەرنى ئېلىپ بېرىڭ, ئاخىرى سۇيىئىستېمال قىلىڭ. (سۈمۈرۈلۈش) ھوقۇق بېرىلگەن رازمېرلىق سپېكترى.
ئومونت يۇمشاق دېتالىنى ئىشلىتىپ تولۇق ۋارقىراپ-جارقىراپ-جارقىراپ كەتكەن سپېكترىغا ئېرىشكەن ماس 4.11 يۇمشاق دېتاللىرى ئاساسىي يېزىقچىلىق, فورمىنى رەتلەش (∥) 69 ياكى ئۇنىڭدىن يۇقىرى بولۇپ, ھەر بىر ئاقسىلنىڭ ئىككىنچى قۇرۇلمىسىغا ماس كېلىدىغان, ھەر بىر قوشنا IM'1) ۋە ھەر بىر پۈتۈن مەملىكەت قۇرۇلمىنىڭ بىر قەدەر ئومۇمىي سومما ھېسابلىنىدۇ. مىقدارى (%), يەنى يۇقىرى پەللىگە كۆتۈرۈلدى. ھەر بىر ئەۋرىشكى ئۈچۈن ئۈچ پاراللېل ئېلىپ بېرىلدى.
3.2.4 گىلەم ئاقسىللىقنىڭ Surface Hydrophouth نى بەلگىلەش
كاتو ۋە دىنۋا (1980] نىڭ ئۇسۇلىنىڭ دوكلاتىغا قارىغاندا, 1980], ناتفەين سۇلفسون كىلسىدلىت كىسلاتا (AND) ئەجەللىك تەكشۈرۈش سۈپىتىدە تارقىتىلغان. ئېغىرلىقى 100 مىللىمېتىر ئاقسىل قاتتىق قۇۋۋەت يۇمشاق دېتاڭ, ئۇنى 15 ئىنگلىز 32 فونكتا بۇفتىلدېلغا, ئاندىن 7000 rm لىق قوزغىدى, ئاندىن 7000 rm لار بىلەن ئارىلاشتۇرۇپ, كۆكرەك پارلاق ئۇسۇلنى ئۆلچەيدۇ. ئۇششاق-چۈشكۈندىن ھالەتنى ئاسناشقا ئورۇنلۇق, ئۇلار ئۆلچەش نەتىجىسىگە ئاساسەن, پارتلاش ئارقىلىق PBS ئۈچۈن PBS غا ئېلىنىدۇ, ئاقسىل مەركەزلىشىش 0 .02.5.5.c / MLG / MLG.
ھەر بىر GLADIT MAX ھەل قىلىش چارىسى (4 MML / L), ئاندىن تېزلا تەۋرىگەن يورۇقلۇققا يەتكەن. NM ھاياجانلانغان نۇر ۋە 484 دە بۇلغىما قويۇپ بېرىش نۇرى سۈپىتىدە. Surface Hydrophobication ناتوسىكلىتقا قارىتىلغان ئاقسىل مەرۋايىتلار بىلەن ماسلاشتۇرۇلغان. ھەر بىر ئەۋرىشكە كەم دېگەندە ئۈچ قېتىم تىترەپ كەتتى.
3.2.4 ئېلېكترون مىكروسكوپى كۆزىتىش
بەزى ئەۋرىشكە شىركىتى HPMC قوشماي, بەزى ئەۋرىشكە ئۈزۈلۈپ قالغاندىن كېيىن, بەزى ئەۋرىشكە ئۈزۈلۈپ قالدى, بۇ ئەۋرىشكە چىققۇدى, ئاندىن ئېلېكترونلۇق سىيدى سانتالانغان. مورفولوگىيىلىك كۆزىتىش ئېلىپ بېرىلدى. تېزلەش بېسىمى 20 KV غا تەڭشەلدى ۋە چوڭايتىش ۋاقتى 100 قېتىم بولدى.
3.2.4.10 سانلىق مەلۇمات بىر تەرەپ قىلىش
بارلىق مىنىستىرلىق 4 ئۆلچەملىك 4 خىل ئۇسۇل قائىدىسى بولۇپ, ئېلېكترون مىكروسكوپنى سىكاننېرلاشتىن باشقا كەم دېگەندە ئۈچ قېتىم تەكرارلاندى. 6.0 نى ئىشلىتىپ راكېتا سىزىش ۋە Spss 19.0 ئۈچۈن. ئۆزگىرىشچان ۋە دانكاننىڭ كۆپ دائىرە سىنىقىنى تەھلىل قىلىش, ئەھمىيىتى 0.05 ئىدى.
3. نەتىجە ۋە مۇنازىرە
3.3.1 ھۆل گلۇتېن خۇلاسەنىڭ رىما خۇسۇسىيىسىدىكى HPMC قوشۇلۇش ۋاقتى ۋە مۇزلاش ۋاقتى
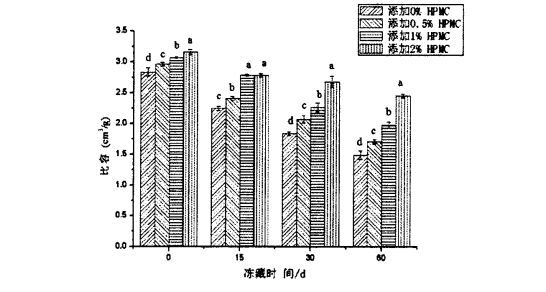
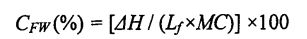
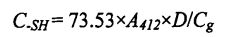
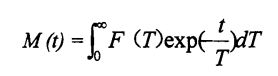
شىلويىلىك خۇسۇسىيەت يېمەكلىك ماتېرىياللىرىنىڭ قۇرۇلمىسى ۋە خاسلىقىنى ئەككاپ بېرىدىغان ۋە مەھسۇلات سۈپىتىنى مۆلچەرگە ۋە باھالاپ, مەھسۇلات سۈپىتىنى مۆلچەرگە ۋە باھالايدىغانلىقى ۋە باھالايدىغانلىقى ۋە باھالايدىغانلىقى ۋە مەھسۇلات سۈپىتى [113J. ھەممىمىزگە ئايان بولغىنىدەك, گللۇېن ئاقسىل خېمىرنى سۈمۈر بېرىدىغان ئاساسلىق ماتېرىيال تەركىب. 3.1-رەسىمدە كۆرسىتىلگەندەك, بارلىق ھۆل گىلاس سۈپال ئۇلارنىڭ خېمىرلاش ياكى ئالداش ھامىلىدارلىق شەكلىدە شەكىللەنگەن دۆلەت ئىچىدىكى دۆلەتتە تۇراقلىق ھالقىغان ENG Link نىڭ ئارقا كۆرۈنۈشى [114] شۇنىڭ بىلەن بىر ۋاقىتتا, گۇناھ ساتىدىغان مۇساپىلەر [114] يەنە بىر چىڭىتىش ۋاقتىنى ئۇزارتىدۇ. 115]. Gluten doughts% 0.5,% 0.5 تۆۋەنلەشنىڭ ئوخشىمىغان دەرىجىدە تۆۋەنلىشى (AM) ac. App 3.1). جىنسىي پەرقلەر (3.1, d رەسىم). بۇ توڭلىتىش جەريانىدىكى HPMC دا HPMC نىڭ ئۈچ ئۆلچەملىك تور قۇرۇلمىسى بۇزۇلغان بولۇپ, بۇلار كاسسىر مودا بولغان (2008) توڭلاتقۇچىنىڭ ئۈچ ئۆلچەملىك تور قۇرۇلمىسىنىڭ ئۈچ ئۆلچەملىك تور قۇرۇلمىسىنىڭ ئۈچ ئۆلچەملىك تور قۇرۇلمىسىنىڭ ئۈچ ئۆلچەملىك تور قۇرۇلمىسىنى بۇزغانلىقىنى كۆرسىتىپ بېرىدىغان. 2008
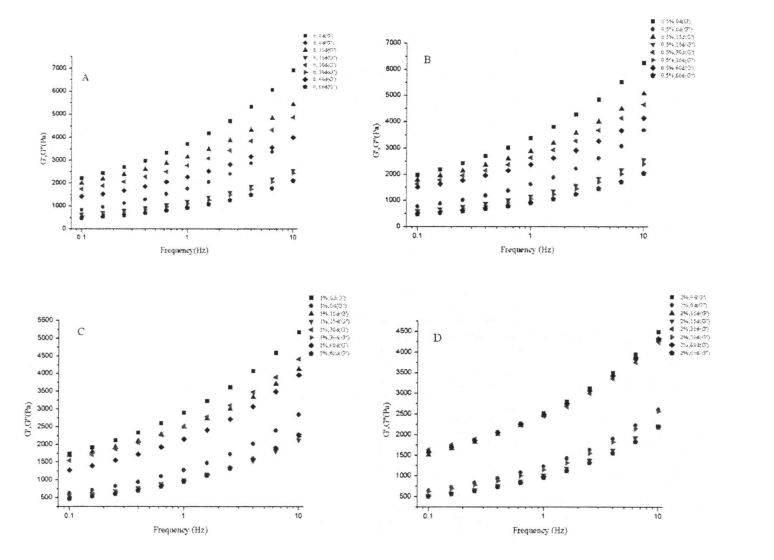
GLUMC LEAP نىڭ 311 ئۈنۈمى ۋە يېقىشلىق خېمىرنىڭ رىياسەتچىسى
ئەسكەرتىش: بۇنىڭ ئىچىدە HPMC نى قوشىسىز ھىلە سۇلياۋ ستۇدىك تەكشۈرۈش نەتىجىسى HPMC: b ئۈزلۈكسىز سىكانېرلاش نەتىجىسى HPMC نىڭ% 0.5 يۇقىرى پەللىگە كۆتۈرۈشى. C بولسا% 1 HPMC قوشۇشنىڭ چاستوتا سىكانېرلاش نەتىجىسى 2% HPMC ھۆل گلۇتېن ئوركانىيە چاستوتىسى قوشۇشنىڭ تەۋرىنىدۇ?
توڭلىتىش جەريانىدا, ھۆل گلۇتان مىللىتىدىكى نېرۋىر كۈچىنىڭ ئۆسۈشىگە ئەگىشىپ, مىلىزىمنىڭ ئۆسۈشىنىڭ ئۆسۈشى (چوڭ-كىچىكلىكى) نىڭ ئۆسۈشىگە ئەگىشىپ, مۇز كىرىستاللىرىنى يوقىتىدۇ. جىمجىت زەمبىرەك ۋە بىر ئاز خىمىيىلىك زايومنى بۇزۇش. قانداقلا بولمىسۇن, گۇرۇپپا توپنى سېلىشتۇرۇش ئارقىلىق كۆرسىتىلىشىچە, HPMC نىڭ قوشۇلۇشىنىڭ قارىشىچە, مۇز خرۇستال يولىنىڭ قۇرۇلۇشى ۋە كۈچىيىشىدە بولىدۇ, بۇ ئارقىلىق Glutuen تور قۇرۇلمىسىنىڭ پۈتۈنلۈكى ۋە كۈچى ۋە مەلۇم دائىرىدە, قوزغىتىش ئۈنۈمى HPMC نىڭ سانى بىلەن ئىجابىي مۇستەھكەملەندى.
3.3 HPMC قوشۇلۇشى ۋە توڭلاتقۇ نەملىك مىقدارى (CFW) ۋە ئىسسىقلىق دەرىجىسى ۋە ئىسسىقلىق ساقلاش ۋاقتى
3.3.2 HPMC قوشۇلۇشى ۋە توڭلاتقۇنىڭ نەملىك رايونى (CFW) دا توڭلاتقۇنىڭ مەزمۇنى (CFW) دا مۇزلۇق ساقلاش ۋاقتىنى قوزغىدى
مۇز كىرىستاللىرى مۇزلاش نۇقتىسىنىڭ ئاستىدىكى تېمپېراتۇرا ئۆتۈشى بىلەن شەكىللەنگەن باسقۇچلار قۇرۇلدى. شۇڭلاشقا, Setigable سۇنىڭ مەزمۇنى توڭلىتىلغان خېمىردىكى سان كىرىستاللارنىڭ سانى, چوڭلۇقى ۋە تارقىلىشىغا تەسىر كۆرسىتىدۇ. تەجرىبە نەتىجىسى (جەدۋەل 3.2) 02-جەدۋەلدىن باشلاپ مۇزنىڭ ساقلاش ۋاقتى بولۇپ, ھۆل تاۋ خەلىپىرلىق جۇڭگونىڭ پايچېكى ئۆرلەپ, قايسىسى باشقىلارنىڭ تەتقىقات نەتىجىلىرى بىلەن بىردەك [117.1ھۇش نەتىجىسى بولۇپمۇ 60 كۈن توڭلىتىلغان ساقلاشتىن كېيىنكى HPMC% 23.207.27, ئېشىش مىقدارى% 23.27 بولۇپ, ئېشىش مىقدارى% 23.27 بولۇپ,% 9.78 كە چۈشۈپ,% 19.59 ئاشقان. قانداقلا بولمىسۇن, ئەۋرىشكىلەرنىڭ% 20.5 بىلەن تولۇقلانغاندىن% 1.5, توڭلىتىش, Chnize نىڭ ئايرىم-ئايرىملىكى 20.07%, 63,% 15.96 ئاشتى, 16,% 15.96 ئاشتى, بۇلار ماتدا, A1 دە. (2008) قۇرۇق ئەۋرىشكىلەرگە سېلىشتۇرغاندا, قۇرۇق ئەۋرىشكىلەرگە سېلىشتۇرغاندا [119].
CFW نىڭ كۆپىيىشىدى ئاساسلىقى قايتۇرۇۋېلىش جەريانى ۋە گلۇېنت ئاقسىللىق تەدبىر قوللىنىلغاندىن كېيىن, سۇنىڭ تازىلىقسىز سۇدىن يېقىلغۇسىز سۇغا ئۆزگەرتىدۇ. بۇ ناشرېغلىق دۆلەتلەرنىڭ ئۆزگىرىشى مۇز كىرىستاللىرىنىڭ تور قۇرۇلمىسى بار بولۇپ, تور قۇرۇلمىسى (ئىشغار-تەرەت) ئاستا-ئاستا يىراقلاپ كەتتى. قانداقلا بولمىسۇن, ئەۋرىشكە بىلەن داغلىق Windows ۋە ئارقا مەھسۇلاتلارنىڭ مەلۇم مەزمۇنىنىڭ مۇھىم پەرقى كۆرسىتىلگەنلىكى ئېنىقكىچە, ئۇ يەردە مۇخبىرلارنىڭ يېغىشىڭ تور قۇرۇلمىسىغا ئازايتالايدىغانلىقىنى, ھەتتا مەھسۇلاتنىڭ سۈپىتىنى چەكلەيدۇ. ناچارلىشىش.
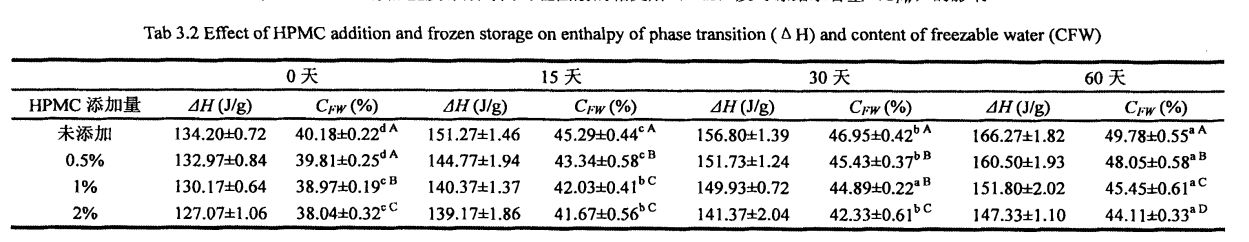
3.3.2.2 گىچە Gluten ئاقسىلنىڭ ئىسسىق بولمىغان مەزمۇنىدىكى HPMC ۋە مۇزلاش ۋاقتىنى
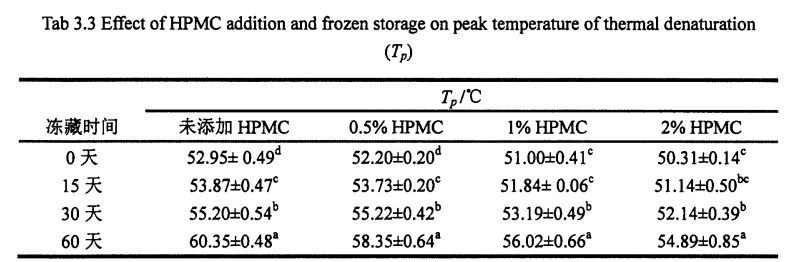
گوللۇېننىڭ كىرمەسلىك مۇقىملىقى زور بىر تەرەپ قىلىنغان پىشانىڭ شەكىللىنىشى ۋە مەھسۇلات سۈپىتىگە [211]. رەسىم 3.2 نىڭ تېمپېراتۇرىسى ۋە ئىسسىقلىق ئېقىمى (° C) بىلەن ئەڭ يۇقىرى بولغاندا DSGRISH نى كۆرسىتىدۇ. تەجرىبە نەتىجىسى (جەدۋەل 3.3) تىزىسىز سىيرىلما ئاقسىلنىڭ ئىسسىقلىقنىڭ دېزىنۇمنىڭ ئىسسىقلىق پەسلىدىكى ئىسسىقلىقنىڭ تېمپېراتۇرىسىنىڭ ئىسسىقلىقنى ئاشۇرۇۋېتىش تېمپېراتۇرىسىنىڭ ئۆيىدە XPMC نىڭ ئىسسىقلىق پەسكىچە بولغانلىقىنى بايقىدى, بۇ لېئون, ES A1 بىلەن بىردەك بولغانلىقىنى بايقىدى. (2003) ۋە كالھار, باراكار ۋە لاي سېگل (2013) 2013-يىلى) مۇشۇنىڭغا ئوخشاش كۆرگەزمە نەتىجىسىنى [2013 120M1. نوقۇل ئاقسىللىق ئۇنىۋېرسال ئاقماستىن% 0 لىك,% 0.4 ئۆسچە, ئىسسىقلىق مىقدارى% 0.40 to, 6.15 ℃, 5.02 ℃ ۋە 4.58 ℃, 5.02. ئېنىقكى, ئوخشاش مۇزلۇق ساقلاش ۋاقتى ئاستىدا, دېنىسى چوققىسىنىڭ تېمپېراتۇرىسىنىڭ ئۆسۈشى (N) HPMC دىن ئۆسۈشىگە ئەگىشىپ, HPMC دىن ئېشىپ كەتتى. بۇ يىغلاشنىڭ ئۆزگىرىشىدىن ماس كېلىدۇ. ئۇنىڭدىن باشقا, Unfrozen ئەۋرىشكى ئۈچۈن HPMC قوشۇلغان ئۆسۈم نىسبىتىگە ئوخشاش, N قىممەت دەرىجىسى توغرا تۆۋەنلەيدۇ. بۇ بەلكىم HPMC چوڭايتىلغان يەر يۈزى ۋە Gluth تېخىمۇ يېقىشلىق ۋە كەڭ كۆلەمدە بۇزۇلغان ۋە ئالدامچىلىق جىنايىتى بىلەن ئارىلىشىش سەۋەبىدىن بولۇشى مۇمكىن.
شۇنىڭدىن كېيىن: Myers ئوخشاش بىر ئىستوندىكى ئوخشىمىغان دەرىجىدىكى خەتكۈچ (p <0.05) كۆرۈنەرلىك پەرق (p <0.05) كۆرۈنەرلىك پەرقلەنگەن (1990-يىل ئاقسا قوزغاتقۇچ قوزغاتقۇچنىڭ تېخىمۇ ئارزۇسى توپلاشقانلىقى ۋە مولېكۇلنىڭ مۇددىئاسىغا قاتنىشىدىغانلىقىنى [1231] دەپ قارىدى. شۇڭلاشقا, گلۇتاندىكى گىدروپولوگىيەلىك گۇرۇپپىلار توڭلىتىشتىن ھالقىغان, ھەمدە HPMC نىڭ مولېكۇلا ئايلىقىنى ئۈنۈملۈك مۇقىملاپ قالالايدۇ.
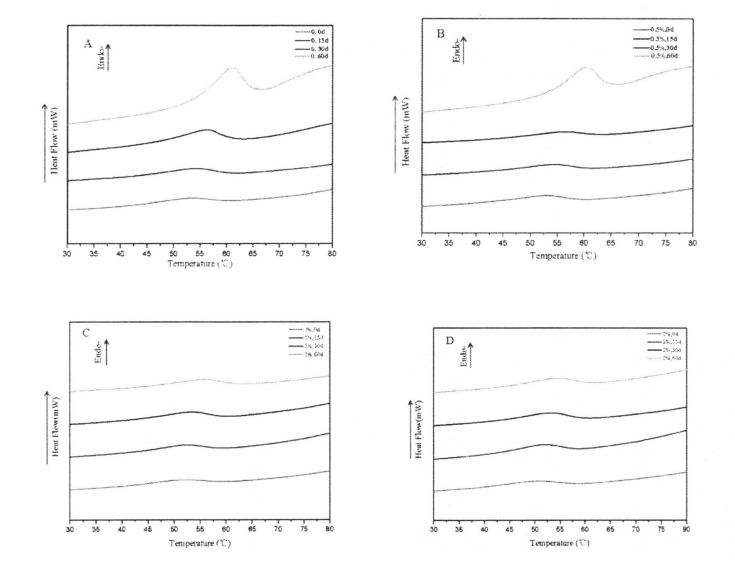
3-رەسىمدە يېقىشلىق ئاقسىلنىڭ تىپى% HPMC (A);% 1) HPMC (C) بىلەن% 1 HPMC (D) بىلەن ئەڭ تۆۋەن ئەگرى سىزىق بىلەن تەمىنلەيدۇ. ئەسكەرتىش: A HPMC نى قوشماي, بۇغداي گراجى B. DSC ئەگمىسى% 5 hpmc C بولسا% 1 HPMC بىلەن بۇغداي گرادۇس D بۇغداي گلۇتېن بۇغداي گلۇتېننىڭ DSMC 3.33.33 نىڭ DPMC 3.3.3 نىڭ DPMC 3.3.3 نىڭ DPMC 3.3.3 نىڭ DPMC 3.3.3 غىلوكترى (C- CH) نىڭ ۋە توڭلىغۇچە يېقىشلىق بولغان تالاش-تارتىشى, خېلى بىلوگ تور قۇرۇلمىسىنىڭ مۇقىملىقى ئىنتايىن مۇھىم. (--------S -S-) ئىككىسىز SULFHHYDRYL گۇرۇپپىسىنىڭ دېۋىلدروللىق بىلەن شەكىللەنگەن ئالۋاستى. Glutenin Glutenin ۋە GlipaDin ۋە Glaidin ۋە Indlenleclolenclolensulfulfulfulfulfulىن بۇزۇلۇپ, كېيىنكىسى پەقەت ئانتلېكلى چوققىلى زايومى ھاسىل قىلالايدۇ [1241] شۇڭا, مەندە پارچىلىۋېتىش زايومىيىسى IROULECLECLECLECOULE DONDUS ھالقىلىق باغلىنىشنىڭ مۇھىم ئۇسۇلى. 100%, O. in c-shining نى بېسىپ% 5, O. C SH% 5 ۋە% 5 ۋە% 5 ۋە% 5 ۋە 1 HPMC نى ئايرىم-ئايرىم ھالدا ئېشىش نىسبىتى بىلەن ئوخشىمىغان دەرىجىدىكى ئېشىش نىسبىتى بار. بولۇپمۇ HPMC نىڭ HPMC نىڭ HPMC نىڭ HLUT C. Mel / g دىن 8.25 "MOL / G ۋە 1.33" Mol / G دىن% 56.2 "MOL / G دىن% 56). توڭلىتىش مۇددىتى 12 كۈن بولغاندىن كېيىن, ھەقسىز Tvertle ئاقسىل قۇرۇلمىسىنىڭ تەركىبى كۆرۈنەرلىك [1071-نومۇرلۇق پىششىقلاپ ئىشلەش دەۋرىگە قارىغاندا پۈتۈنلەي تۆۋەن بولدى [1071-چاي گۆش پەسەيتەلەيدۇ ۋە تارتىنچاق تېشىپ كېتىشى يەرلىكتە شەكىللەنگەن توڭلىتىش ۋاقتى [1161. ۋاڭ, Et A1 قاتارلىقلار. (20) بايقالغان 15 كۈنلۈك ئاقسىلنى توڭلىتىشنىڭ باھاسى% 2 HPMC% 2 HPMC بىلەن كۆرۈنەرلىك ئاشتى, بۇ يېمىش ئاققۇنى 15 كۈن ئىچىدە تولۇقلىدى.
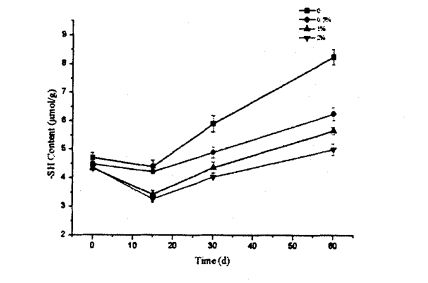
CLUC نىڭ ئۈنۈمى HPMC قوشۇلۇشى ۋە يېكىلابىل سۇ كلاسسىكنىڭ مەزمۇنىدىكى توڭلىتىلغان ساقلانمىلار تۆۋەن تېمپېراتۇرادىكى مۇز كىرىستالچىلىقنى شەكىللەندۈرىدۇ ۋە سىيرىلۇن تورىنىڭ ئۆز-ئارا تەقسىملىنىشى ئۈچۈن مۇز كىرىستال شەكىللەندۈرەلەيدۇ. شۇڭلاشقا, مۇزلاشنىڭ ئۇلىنىشى زور بولغاچقا, مۇز Gluten ئاقسىل قۇرۇلمىسىنىڭ تېخىمۇ ئېغىر بولۇپ, بەزى ئارىلىيالغىچە بىر قىسىم ئارىلىش ئايىغىنىڭ مىقدارىنى ئۆستۈرىدۇ. يەنە بىر تەرەپتىن, تەجرىبە نەتىجىسىدە تارقىلىش نەتىجىسىدە مۇز خرۇستالنىڭ كەمتۈكلۈك زايومىسىنى قوغدايدىغانلىقىنى كۆرسىتىپ بېرەلەيدۇ, بۇ يەرگە Glutuen ئاقسىلنىڭ چېكىنىغان مۇساپىسىنى بېسىپ چۈشۈرىدۇ. 3.3.4 HPMC نىڭ ئاستى ئىجارىلىك ۋاقتى, ئارىلىق ئارام ئېلىش ۋاقتى ۋە مۇزلۇق ئارام ئېلىش ۋاقتى (T2) سۇ مەھسۇلاتلىرىنىڭ مودېل ۋە ھەرىكەتچان مۇساپىسىنى ئەكس ئەتتۈرەلەيدۇ [6]. 3.4-رەسىمدە ئوخشىمىغان HPMC تولۇقلىمىسى تارقىتىلغان, 4-نومۇرلۇق MS (T21 Ms (T22), 10.100 Ms (ئۆلگەن) ۋە 1 00 دىن 1 لىك ms (T24 Ms (T24 Ms) نى ئۆز ئىچىگە ئالىدۇ. بومبا قاتارلىقلار. (2012-يىلى) ھۆل گلۇلۇن ماسسىسىنىڭ توشۇلغان سوممىسى [1261 دىن كېيىن, ئۇلار 20-نومۇرلۇقتا باغلىنىشنىڭ باغلىنىشى بىلەن رەتكە بولىدۇ, ھالبۇكى يېقىلغۇ ئاقسىلغا باغلانغان باغلىنىشنى تارقىتىشى مۇمكىن. بۇنىڭدىن باشقا, Kontogiorgos (2007) - TDUND ئاقسىل تورى قۇرۇلمىسىنىڭ بىر قانچە قاتلى (شراتت) چەكلىك سۇ (ياكى سىيرىلما سۇكى قىلىنغان سۇ), بۇ سۇنىڭ يۆتكىلىشچانلىقى بار-ۋە سۇغا ۋە ھەقسىز سۇنىڭ يۆتكىلىشىدىن تەركىب تاپقان. ۋە T23 چەكلەنگەن سۇنىڭ ئارام ئېلىش ۋاقتىغا ماس كېلىدۇ. T24 تارقىتىش (> 100 ms) نىڭ ئۇزۇن ئارام ئېلىش ۋاقتى بار, شۇڭا ئۇ كۈچلۈك ھەرىكەتچانلىقى بىلەن ئازادە سۇ. بۇ سۇ تور قۇرۇلمىسىنىڭ تۆكۈشىدە, گلۋېن ئاقسىل سىستېمىسىدىكى ئاجىز مەجبۇرىيەت كۈچى بار.
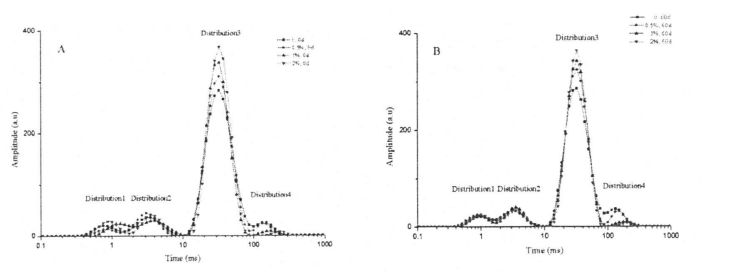
Fippmc نىڭ 44 نىڭ ئۈنۈمى ۋە ئېچىلىش ۋاقتى Gluten خېمىنىڭ تەتۈر ئارام ئېلىش ۋاقتى
ئەسكەرتىش: A ۋە B تەتۈر بوزەك قىلىش ۋاقتى (N) نىڭ ئوخشىمىغان مەزمۇنى بىلەن MPMC نىڭ ئوخشىمىغان مەزمۇنى بىلەن 14 كۈن ۋە 60 كۈن قوشۇلغان
توڭلىتىش ماشىنىسىنى ئوخشىمىغان باھادا ساقلانغان, NPMOZen ساقلانمىلىرىنى سېلىشتۇردى, T21 ۋە T24 T21 ۋە T24 نىڭ ئومۇمىي تارقىتىش رايونى كۆرۈنەرلىك پەرق ئېلىپ, كۆرسىتىپ بېرىدۇكى, HPMC چەكلەنگەن سۇنىڭ ئومۇمىي مىقدارىنى كۆرۈنەرلىك ئۆستۈرگەنلىكى بايقالىتتى. مەزمۇن بولۇشى مۇمكىن, بۇ بەلكىم ئاساسلىق سۇ چەكلەش كۈچىگە ئىگە بولغاچقا, ئاز مىقداردىكى كرەنىك بىلەن) ئاز مىقداردىكى HPMC نى قوشۇشى كۆرۈنەرلىك ئەمەس. يەنە بىر تەرەپتىن, كىچىك تىپتىكى يىرىڭلىشىش يۈز بەرگەندە T21 بىلەن T24 ياكى TPMC نىڭ تارقىتىقىدىمۇ, مۇھىم ئۆزگىرىش بار, ھەمدە مۇھىتقا پاسسىپ تەسىر كۆرسىتىدۇ »دېورلۇقنىڭ بىر قەدەر مۇقىملىقىنى كۆرسىتىدۇ, ھەمدە مۇھىتقا پاسسىپ تەسىر كۆرسىتىدۇ. ئۆزگەرتىشنىڭ سەزگۈرلىكى ئاز, ئازراق تەسىرگە ئۇچرىمايدۇ.
قانداقلا بولمىسۇن, TOZ3 نى توۋلىغان ھۆل بولۇپ, ئوخشىمىغان HPMC. نىڭ قېپى ۋە رايونىنىڭ ئېگىز پەرقىدە كۆرۈنەرلىك پەرق بار بولۇپ, بۇنىڭدىن باشقا, T23 تارقىتىشنىڭ ئېگىزلىكى ۋە رايونى ئۆرلەيدۇ. 3.4). بۇ ئۆزگىرىش شۇكى, HPMC چەكلىك سۇنىڭ نىسبەت ئومۇمىي مەزمۇنىنى كۆرۈنەرلىك ئاشۇرغاندا, ئۇ قوشۇلما قىممەت ئىچىدىكى قوشۇمچە سومما بىلەن مۇناسىۋەتلىك. ئۇندىن باشقا, مۇزغا ساقلاش ۋاقىتنىڭ كېڭەيتىلىشى, ئوخشاش HPMC مەزمۇنى بىلەن بولغان ھۆل گىلۋېن ماسسىسىنىڭ تارقىلىشى ۋە رايونى ئوخشىمىغان دەرىجىدە تۆۋەنلىگەن. شۇڭلاشقا, باغلانغان سۇغا سېلىشتۇرغاندا, چەكلىك سۇ مۇزاي تۇتۇشقا مەلۇم ئۈنۈم كۆرسەتتى. سەزگۈرلۈك. بۇ يۈزلىنىش گۇمىېن ئاقسىل ماتورلۇق ماترىسسانىڭ ئۆز-ئارا تەسىر كۆرسىتىلىشىچە, گاڭگىراپ قالغان سۇ ئاجىزلاپ كېتىدۇ. بۇ بەلكىم تېخىمۇ كۆپ گىدروپوبىك گۇرۇپپىلىرى توڭلىلىشى مۇمكىن, چۈنكى ئۇ توڭلىتىش توقۇنۇشى يۇقىرى پەللىدە پىششىقلاپ ئىشلەش. بولۇپمۇ T23 نىڭ T23 تارقىتىشنىڭ ئېگىزلىكى ۋە رايونى 2% HPMC قوشۇلغان كۆرۈنەرلىك پەرقنى كۆرسەتمىدى. بۇ HPMC نىڭ كۆچمەسلىكىنى چەك قىلىپ, سۇنى قايتا قۇرۇشنىڭ چەكلىنىشى, ھەمدە سۇنىڭ توڭلىتىلغان جەرياندا سۇ دۆلىتىنىڭ ئۆزگىرىشىنى چەكلىيەلەيدىغانلىقىنى كۆرسىتىپ بېرىدۇ.
ئۇنىڭدىن باشقا, HPMC نىڭ ئوخشىمىغان مەزمۇنى ئارقىلىق T24 تارقىتىش تىپى ۋە رايونى (3.4, A), ھەقسىز سۇنىڭ نىسپىي تەركىبى ۋە ھەقسىز سۇنىڭ نىسپىي تەركىبى ۋە ھەقسىز سۇنىڭ نىسپىي مەزمۇنى HPMC قوشۇلدى. بۇ پەقەت داڭ تەقسىملەشنىڭ ئەكسىچە. شۇڭلاشقا, بۇ خىل ئۆزگىرىش قائىدە HPMC نىڭ سۇ ئاستى ساقلاش ئىقتىدارى بارلىقىنى ۋە ئەركىن سۇنى ئايلىنىپ يۈرگەنلىكىنى كۆرسىتىدۇ. قانداقلا بولمىسۇن, توڭلىتىشنىڭ 60 نەچچە كۈندىن كېيىن, T24 تارقىتىش ئارقىلىق, سۇنىڭ ئېگىزلىكى ۋە رايونغا يەتتى, سۇنىڭ توڭلىتىش جەريانىدىكى ھەقسىز سۇنى ھەقسىز ئايلىنىۋاتقان دۆلەتكە ئۆزگەرتىلگەن. بۇ ئاساسلىقى يېمىدىن ئاقسىلانى زورلانغان ئۆزگىرىش ۋە گرانتېن قۇرۇلمىسىنىڭ «قەۋىتى» ئورۇنلىرىنىڭ بۇزۇلۇشى سەۋەبىدىن, بۇنىڭ ئىچىدە مۆتىدىل سۇنىڭ ھالىتىنى ئۆزگەرتكەنلىكىدىن ھەيران قالدى. گەرچە خۇكتە ئۇنىۋېرسال سۈيىنىڭ مەزمۇنىنىڭ مەزمۇنىنىڭ مەزمۇنىنىڭ مىقدارىمۇ ئېشىقى توپا بولغاندا% 2 HPMC بىلەن ئىككىدىن كېيىن, توڭلىغاندا سۇيىقەستتە بولدى, HPMC نىڭ سۇ ئورنىنىڭ ھېچقايسىسىنىڭ بىخەتەرلىكىنى كۆرسىتىپ بېرەلەيدۇ دېگەن بولىدۇ. ۋە مۇقىم ئوبوروت.
HPMC VIST نىڭ 1.3.5 نەتىجىسىنى ۋە مۇزلۇق ساقلاش ۋاقتى
ئومۇمەن قىلىپ ئېيتقاندا, ئاقلىقنى ئۆزلەم قۇرۇلمىسى تۆت خىل, α قاچىلانغان, β-بۇلۇڭ ۋە تاسادىپىي برايلارغا ئايرىلىدۇ. ئاقسىلنىڭ بوشلۇق كىرگۈزۈش ۋە مۇقىملىشىشىنىڭ مېدروگېن زايومى بار. شۇڭلاشقا, ئاقسىل دېگۈبە ھىدروگېننىڭ زايوم بۇزۇلۇشى ۋە ئۆزگىرىشى.
تۆتىنچى ئەسىردە يۈز بەرگەن سكۈچغۇچ (FT -R ICO) (FT -R) نىڭ يۇقىرى دەرىجىلىك قۇرۇلمىسىغا ئىشلىتىلىدىغان يۇقىرى ئىشلىتىلىدۇ دەپ ماس كېلىدۇ. ئاقسىلنىڭ رەقىبى راك كېسىلىگە ئاساس قىلىنغان شەكىللىك بەلۋاغ ئاساس قىلىنىدۇ, مەن مۇزىكا ئەترىتى (1700.1600 CM-1), Amide II مۇزىكا ئەترىتى (1600.1500 سانتىمېتىر) ۋە Amide III بەلۋاغ (1350.1200 CM-1). ماس ھالدا, مەن سۈمۈرگۈچ كاربونېل گورۇھىنى ئەترىتى (--C = O-) [--N-) [--N-) [1271], مەن ئامىنونىڭ تەۋرىنىشىدىكى ئامىنوننىڭ تەۋرىنىشى سەۋەبىدىن ئاقسىلنىڭ تەۋرىنىشى ۋە ئاقسىل ئىككىلىنىش قۇرۇلمىسىنىڭ سەزگۈرلىكى بار [138'1291. گەرچە يۇقىرىدا ئۈچ خىل ئالاھىدىلىك بەلۋاغ ئادەتتە ئاقسىلنىڭ ئالاھىدىلىكى بارلىق ئالاھىدىلىكلىكىنىڭ ھەممىسى ئاقىلانە تەقلىدلەشتۈرگۈچ بولۇپ, شۇنىڭ بىلەن باشقا سۆزلەر AM بىر تەرەپلىك II مۇزىكا كۈچىنىڭ ئومۇملىشىشى تۆۋەن, شۇڭا ئاقسىل, ئاقلام ئۇنىۋېرېل ئىككىلەملىكنىڭ ئۆلچىمى نامراتلار. Seak نىڭ مالىيە مەبلىغىنىڭ يۇقىرى دەرىجىلىك مۇستەھكەم بولۇپ, نۇرغۇن تەتقىقاتچىلارنىڭ ئىككىنچى قۇرۇلمىسى [1301-نومۇرلۇق قۇتۇپتىن باشقا, سۇنىڭ سۈمۈرۈلۈش چوققىيىسى ۋە مەن 140 سانتىمېتىر ئەتراپىدا ئىدى. 1 ۋارنبۇم (قاپلانغان), بۇ بۇرۇلۇش نەتىجىسىنىڭ توغرىلىقىغا تەسىر كۆرسىتىدۇ. شۇڭلاشقا, سۇنىڭ كىچىكلىنىشى مەن سىزنى ئاقلاق ئوتتۇرىسىنى بېكىت قىلىمەن ئاق بىرىكسىيە ئىككىلەمچى قۇرۇلمىنى بېكىتىدۇ. بۇ تەجرىبەكىدا ناشتا قىلىشتىن ساقلىنىش ئۈچۈن, Glutut 201 ئايلىك ئاقيانلارنىڭ تۆت مۇساپىسى IM نىگېيىنى تەھلىل قىلىش ئارقىلىق ئېرىشكەن. چوققا ئورنى (دولقۇن ئۆز-ئارا ئارىلىق)
خاسلىق ۋە قۇرۇلۇش ۋاقتى 3.4 جەدۋەلدە كۆرسىتىلدى.
Tab 3.4 چوققا ئورنى ۋە ئىككىلەمچى قۇرۇلمىنىڭ ئورنى ۋە ئىككىلەمچى قۇرۇلمىسى
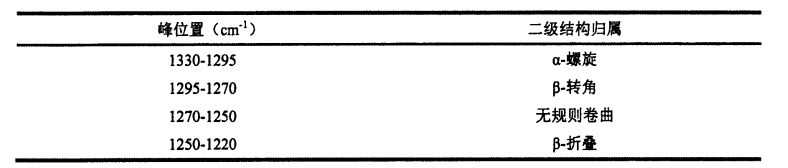
رەسىمدە 3.5 Gluten ئاقسىلنىڭ All IY III مۇزىكا ئەترىتىنىڭ ئىنچىكە ئىنچىكە بولغان سپېت دېڭىزىدىن كېيىن 0 كۈنلۈك iPMC نىڭ ئوخشىمىغان مەزمۇنى بىلەن ئۆتكۈزۈلگەندىن كېيىنكى 0 كۈنلۈك HPMC نىڭ ئوخشىمىغان مەزمۇنىغا كىرىدۇ. (2001) ئىككىنچى تۇغۇنلمىغان ئىككىنچى تۇغۇندىغا ئوخشاش پىشاڭلىق چوققىلارغا ماس كېلىدىغان قوشۇق يۇقىرى پەللە قوللىنىلىدۇ [1321]. 3.5-جەدۋەلنىڭ مۇناسىۋەتلىك مەزمۇنلىرىنى مىقدارلاشتۇرۇش ئۈچۈن, 3.5 گىللىپ ئاقسىللىق ۋاقىتنىڭ ئۈچ ئوتتۇرا دىرېكتورى ۋە ئوخشىمىغان HPMC قوشۇش نىسبىتى (ماس قەدەملىك ئومۇمىي رايون / چوققا ئومۇمىي رايون) نىڭ ئۆسۈشىگە ماس كېلىدىغان كۆپەيتىدۇ.
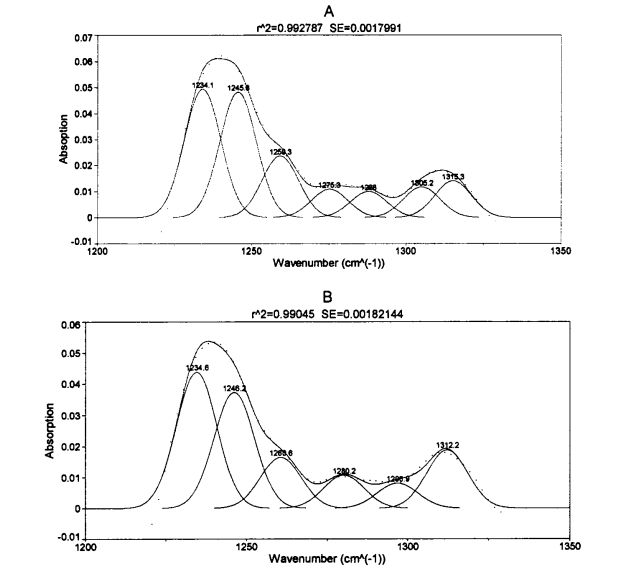
0 D (A) دىن% hpmcen نىڭ% hpmcen نىڭ% hpmcen نىڭ% hpmcen byoContiveli نىڭ AMUTICE MIPCECENT MPMC
ئەسكەرتىش: A STEACENT GPMC نى 0 كۈن توڭلىيالمىسا, بۇغداي گللۇېن ئاقسىلنىڭ ئىنچىكە ئاقسىلى. B بولسا 2% HPMC بىلەن 0 كۈن توڭلىتىلغان بۇغداينىڭ پۈركۈشنىڭ سپرىد ئاقسىل
توڭلىتىش ۋاقتىنى كەلتۈرۈپ چىقىرىپ, گلۇتىسى ئاقسىل قۇرۇلمىسى HPMC نىڭ ئوخشىمىغان بەلگىلىمە بويىچە HPMC نىڭ ئوخشىمىغان دەرىجىسىگە ئۆزگەرتىلگەن. شۇنى كۆرەيكى, بۇ سىزنىڭ ھەممىنى تەبرىكلەش ۋە HPMC نىڭ ئىككىلەمچىلىكىنىزلنىڭ ئىككىنچى قۇرۇلمىسىنىڭ تەسىرىگە ئۇچرايدىغانلىقىنى كۆرگىلى بولىدۇ. HPMC نىڭ قانداق بولۇشىدىن قەتئىينەزەر, B. قاتلانغان قۇرۇلما ئەڭ ئاساسلىق قۇرۇلما بولۇپ,% 60. 60 كۈندىن كېيىن, 60 كۈن توڭلىتىلغان ساقلاش بوشلۇقى,% 5, ئېنىق 5% 5 ۋە% HPMC نى قوشۇڭ. دەرىخىنىڭ بولغىنى ئايرىم-ئايرىم مەزمۇنلار ئىچىدە 3.66 كۆرۈنەرلىك ئاشتى, ئايرىم-ئايرىم ھالدا% 3.66 ۋە 1.87 كۆرۈنەرلىك ئاشتى, بۇ نەتىجىدە Mezian قاتارلىق ئەقىدىگە ئوخشۇلدى. (2011) [L33J]. قانداقلا بولمىسۇن, يېمىڭلىق ساقلانغان يېقىشلىق ساقلىغۇچ 2% HPMC بىلەن تولۇق ئۆزگىرىش يۈز بەرمىگەن. بۇنىڭدىن باشقا, 0 كۈن توڭلىتىلغاندا, HPMC قوشۇلۇشى, Ppmc بۇنىڭدىن تەڭ, p. بۇتلۇقلارنىڭ كاللىسىنىڭ تەركىبى ئازراق تەرەققىي قىلدى, بولۇپمۇ قوشۇلما قىممەت نىسبىتى% 2, P بار. قاتلىنىدىغانلارنىڭ تۇغقان مەزمۇنى% 2.01 ئاشتى. D. قاتلانغان قۇرۇلمىنى ئۆز-ئارا ئايلاندۇرغىلى بولىدۇ. قاتلاش (ئاقسىل مولېكۇلا) نىڭ توپلاشتىن كېلىپ چىققان), ANGERAPERALLELELELE P. قاتلانغان ۋە پاراللېل p. ئۈچ چوڭ ھالەت قاتلىدۇ, مۇزلاش جەريانىدا قايسى ماددىلارنىڭ قايسى ماددىلارنى قاندۇرۇش جەريانىنى ئېنىقلاش تەس
ئۆزگەرتىلدى. بەزى تەتقىقاتچىلار B دەرىجىلىك قۇرۇلمىنىڭ مۇناسىۋەتلىك مەزمۇنىنىڭ نىسبەت نىسبىتىگە زورلىغانلارغا ئىشىنىدۇ [steric ئۆزگەرتىشنىڭ ئېشىشىنىڭ كۈچىيىشى [41] ۋە باشقا تەتقىقاتچىلار بۇ p دەپ قارايدۇ. قاتلانغان قۇرۇلمانىڭ ئېشىش سۈرئىتىنىڭ ئېشىشى يېڭىلىق رەڭلىك شەكىلنىڭ بىر قىسمى بولۇپ, ھىدروگېن باغچىسى بىلەن ساقلانغان قۇرۇلما كۈچى بىلەن ساقلىنىدىغان قۇرۇلما كۈچى بىلەن ساقلىنىدىغان قۇرۇلما كۈچى بىلەن ساقلىنىدىغان قۇرۇلما كۈچى بىلەن ئىگىلىشى بىلەن ھەمرالغا ئىگە قىلىش نىسبىتى [421]. β- قاتلىنىڭ ئېشىشى ئاقسىلنىڭ ئۆسۈشى ئاقسىلنىڭ يۇقىرى كۆتۈرۈلگەنلىكىنى كۆرسىتىپ بېرىدۇكى, DSC تەرىپىدىن ئۆلچەم قىلىنغان چوققا چېكىنىشنىڭ ئۆسۈشىنى كۆرسىتىدۇ. تۆۋەن دەرىجىلىك يادرو ماگنىت ئاساسى قاتارلىقلارنىڭ تارقىتىلىشى بىلەن بىردەك. ئاقسىلنى كۈچەيتىش. يەنە بىر جەھەتتىن,% 0.5 ۋە% 2 ۋە% 2 ۋە% 2 ۋە% 2 ۋە% 2 ۋە% 2 گىچە HPMC Gluten ئاقسىل. Hiex نىڭ نىسبەت نىسبىتى% 0.95 ئۆسۈپ,% 4.42 ۋە 2.0% ۋە 2.42 ۋە 2.0% ۋە 2.03, توڭگۇز بىلەن ۋاڭ% 3.5m, يەنى ۋاڭغا بىلەنمۇ ۋاڭ. (2014) مۇشۇنىڭغا ئوخشاش نەتىجىنى بايقىغان [134]. 0 نىڭ يېتىلىشى HPMC نى قوشتىسىز. توڭلىتىش جەريانىدا ئېگىنىڭ نىسپىي مەزمۇنىدا كۆرۈنەرلىك ئۆزگىرىش بولمىغاچقا, ئەمما قوشۇلۇش سوممىسىنىڭ كۆپىيىشىدىن 0 كۈن توڭلىتىش. Α-ۋەيران بولغان قۇرۇلمىلارنىڭ تۇغقىنىدا كۆرۈنەرلىك پەرق بار.
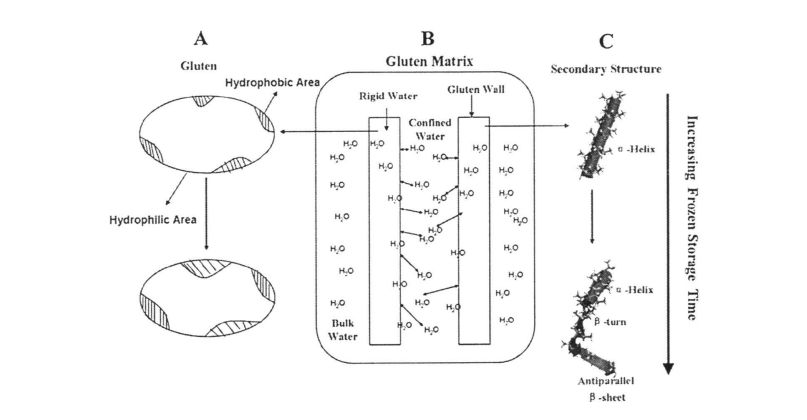
3-رەسىمدىكى گىدروپوبك موتسىكلىيسىنىڭ پىلانى (a), سۇ قايتا جەم بولۇش (b), سۇنى قايتا تەقلىدىي داۋالاش ۋاقتى توڭلىتىلغان ساقلاش ۋاقتى I دەرىجىلىك قۇرۇلما قىممەت (3'138】
توڭلىتىش ۋاقتىنى ئۇزارتىشنىڭ بارلىق ئەۋرىشكىسى, p. بۇلۇتلارنىڭ كاللىسىنىڭ بىر مەزمۇنىنى كۆرۈنەرلىك تۆۋەنلىدى. بۇ ئارقىلىق β-بۇراش توسۇشقا ئىنتايىن سەزگۈر دەپ قارىلىدۇ [135. 1361], ۋە HPMC قوشۇلغان ياكى ھېچقانداق ئۈنۈم بەرمەيدۇ. Wellerer, et A1. . Gluten ئاقسىپىنىڭ ئىختىيارى تۇراقلىق قۇرۇلمىسىنىڭ تۇغقىنى قوشۇلغاندىن باشقا% 2 HPMC بىلەن% 2 HPMC غا كۆرۈنەرلىك ئۆزگىرىدۇ, باشقا ئەۋرىشكە مۇز ئۈزۈلمەسسىمۇ, باشقا ئەۋرىشكە ئېلىشنى كەلتۈرۈپ چىقىرىشى مۇمكىن. بۇنىڭدىن باشقا, Gluen ئاقسىپى توڭلىگەندە, Gluten-Helix نىڭ بىر قانچەسى HPMC نىڭ بىر مەزمۇنى% 2 HPMC نىڭ بىر مەزمۇنى HPMC نىڭ تۇغقان مەزمۇلىدىن% 2 HPMC نىڭ تۇغقان مەزمۇلىدىن% 2 HPMC نىڭ تۇغقان مەزمۇنى HPMC دىن كۆرۈنەرلىك پەرقلەندۈرۈلدى. بۇ بەلكىم HPMC بىلەن GLUEN ئاقلىن ئارىلىقىنىڭ ئۆز-ئارا تەسىر كۆرسىتىلىشىچە, يېڭى گىدروگېن زايولىنى شەكىللەندۈرىدىغانلىقىنى كۆرسىتىپ بېرىدۇ, ئاندىن ئاقسىلنىڭ ئوتتۇرىغا چىقىرىشىغا تەسىر قىلىشى مۇمكىن. ياكى HPMC سۇنى سۈمۈرۈۋالىدۇ, بۇ ئاقسىللىقنى ئىجرا قىلىدۇ ۋە تارماق ئوتتۇرىسىدىكى تېخىمۇ كۆپ ئۆزگىرىشلەرنى كەلتۈرۈپ چىقىرىدۇ. يېقىن. Β جەدۋەل قۇرۇلمىسىنىڭ نىسبەت دەرىجىسى ۋە β بۇرۇلۇش مەزمۇنىنىڭ تۇغما مەزمۇنىنى تۆۋەنلىتىش يۇقىرىدىكى پەرەزلەرگە ماس كېلىدۇ. توڭلىتىش جەريانىدا, نىسبەت ۋە گۇناھنىڭ شەكىللىنىشى ۋە مۇزنىڭ مۇقىملىقىنى شەكىللەندۈرىدۇ ۋە ھىدروگېن مۇراسىمىنى ئاشكارىلاشنى ۋەيران قىلىدۇ. ئۇنىڭدىن باشقا, ئاقسىل نۇقتىزىدىن, ئاقسىلنىڭ تەرەققىي قىلىشىدىن, ئۇ تېخىمۇ مۇقىم. تۆۋەن تېمپېراتۇرىدا, ئۆزلۈكىدىن ئۆز-ئارا مۇلىنىدۇ. قاتلىنىدىغان ۋە ئېچىلىش ۋە ئېچىۋېتىش ئۆزلۈكىدىن) ئۆزلۈكىدىن كىرىپ, ئۆزگەرتىشلەرنى كەلتۈرۈپ چىقىرىدۇ.
خۇلاسە قىلىپ, HPMC ۋە HPMC ۋە HPMC ۋە HPMC نىڭ قويۇق خۇسۇسىيىتى ۋە ئاقسىل بىلەن ئۆز-ئارا تەسىر كۆرسىتىش سەۋەبىدىن HPMC نىڭ ئەقلىي باياناتى سەۋەبىدىن, HPMC GPMC نىڭ ئىككىلەمچىلىقىنى مۇقىملاشتۇرۇپ, ئاقسىل كونتىنى مۇقىملاشتۇرۇشقا ئۈن قالدى.
Gluten ئاقسىل شىركىتىنىڭ WPMC قوشۇلۇشى ۋە باش قان تومۇر ۋاقتىدىكى ساقلاش ۋاقتىنى ئۈنۈم بېرىدۇ
ئاقسىل مولېكۇلالىرى ھەر ئىككى گىدروفىل ۋە گىدرولوبىك گۇرۇپپىلىرىنى ئۆز ئىچىگە ئالىدۇ. ئادەتتە ئاقسىل يۈزلىرى گىدروگېن باغدىن تەركىب تاپقان بولۇپ, ئۇ ھىدروفېن باغچىدىن تەركىب تاپقان, سۇ بىرى سۈيدۈك باغچىلارنى ئېغىرلاشتۇرۇۋېتىدۇ ۋە ئۇلارنىڭ قولىنى ئاسراشنىڭ مۇقىملىقىغا ئالدىنى ئالىدۇ. مايدانىڭ ئىچىنىڭ ئىچى ياشلار تېخىمۇ كۆپ گىدروفبوبىك گۇرۇپپىلارنى ئىشلەپ, گىدروپوبىك پارلىنىش ئارقىلىق قوغدىغۇچىنىڭ ئىككىنچى ۋە ئۈچىنچى دەرىجىلىك قۇرۇلمىسىنى قوغدىدى. ئاقسىلنىڭ قويۇقلىشىشى گىدروپوبىك گۇرۇپپىلىرىنىڭ ئاشكارىلىنىشى ۋە كۆرگەزمە كېسەللىكلىرى بىلەن ھەمراھ بولىدۇ.
HPMC قوشۇش ئۈچۈن HPM3 نىڭ Page3.6 ئۈنۈمى Gluten نىڭ SurfrophoBice
ئەسكەرتىش: ئوخشاش رەتەتتە, M ۋە B بىلەن بولمىغان خەت نۇسخىسى بار, مەلۇم مەنىنىڭ بارلىقىنى كۆرسىتىدۇ (<0.05);
ئوخشاش بىر ئىستوندىكى ئوخشىمىغان دەرىجىدىكى دەرىجىدىكى چوڭ ھەرپلەر (<0.05)
60 كۈندىن كېيىن,% 5,% 5,% 5 لىك Glueen% 43.63, ئايرىم-ئايرىم ھالدا% 43.63,% 36.69 ئاشتى. بولۇپمۇ Rluen ئاقسىلنى قويىسىز, 30 كۈننى باشتىن كەچۈرمەي, 30 كۈننىڭ يۈزى كۆرۈنەرلىك ئاشتى (0. <0. <0. <0. <0. 0. <0. 0. <0. <0. <0. 0. <0. 0. <0. <0.05) ئۆسكەندىن كېيىن, 60 كۈن گىرىي نۇقتا يېقىلغۇلىنىڭ. شۇنىڭ بىلەن بىر ۋاقىتتا, 60 نەچچە كۈن تېز ساقلانمىغاندا, يېنجىنلىق ساقلاش ئوخشىمىغان مەزمۇنلارنىڭ يەرشارى قېقىشچانلىقى ئوخشىمىغان مەزمۇنلارنىڭ بارلىققا بېسىلغان بولۇشى. قانداقلا بولمىسۇن, 60 كۈن توكىرى ساقلانغاندىن كېيىن, گىللېن ئاقسىلانىيچە رېلىسلىك ئاقسىل بىلەن پەقەت% 2 HPMC نىڭ يۈزىنى 26.999 گە يەتتى, بۇ رەقەملىك ساقايتىشنىڭ قىممىتىدىن خېلىيادىن كۆرۈنەرلىك بولدى. بۇ HPMC نىڭ Gluten ئاقسىلنىڭ نارازىلىقىنىڭ رادىرىنى قوزغاپ بارالايدىغانلىقىنى كۆرسىتىپ بېرىدۇ, بۇ ئىسسىقلىقنىڭ تېمپېراتۇرىسىنىڭ تېمپېراتۇرىسىنىڭ تېمپېراتۇرىسىنى بېكىتكىلى بولىدىغان نەتىجىسىدە. چۈنكى HPMC ئەسلىگە كەلتۈرۈش ئارقىلىق ئاقسىل قۇرۇلمىسىنىڭ بۇزۇلۇشىنى چەكلەپ, گىدروفىلغىمۇ,
HPMC ئارقىلىق ئاقسىل يۈزلىرى سىڭىپ كىرىدۇ, بۇ ئارقىلىق ئاقسىلنىڭ يەر يۈزى خاسكىرىنى ھاسىل قىلالايدۇ, گىدروپ گۇرۇپپىلىرىنىڭ ئاشكارلىنىشى (جەدۋەل 3.6).
3.3.7 hpmc ھۆججىتىنىڭ باھاسى GLUTen نىڭ مىكرو تور قۇرۇلمىسىنىڭ مىكرو قۇرۇلمىسى ۋە مۇزېيىش ۋاقتى ۋە مۇزلۇق ساقلاش ۋاقتى
ئۈزلۈكسىز تور قۇرىمى خېھرەتنىڭ دەلىل-ئىسپات بىرلىمىسىدا ئىشلەپ كەلگەن كاربون تۆت ئوكسىد گازنى ساقلاپ قېلىش ئۈچۈن نۇرغۇن ئىششىق بار. شۇڭلاشقا, Gluten تور قۇرۇلمىسىنىڭ كۈچلۈك ۋە مۇقىملىقى, كونكرېت ھەجىملىك, سۈپەتلىرى ۋە سەزگۈر باھالاش قاتارلىق ئاخىرقى مەھسۇلاتقا ئىنتايىن مۇھىم. مىكروسكوپ نۇقتىسىدىن قارىغاندا, ماتېرىيالنىڭ Serverk Verpholologatologololad نى سىپكالاشتۇرۇش تور مىكروسكىپكىلاش جەريانىنى مۇزاكىرە قىلىش ئارقىلىق.
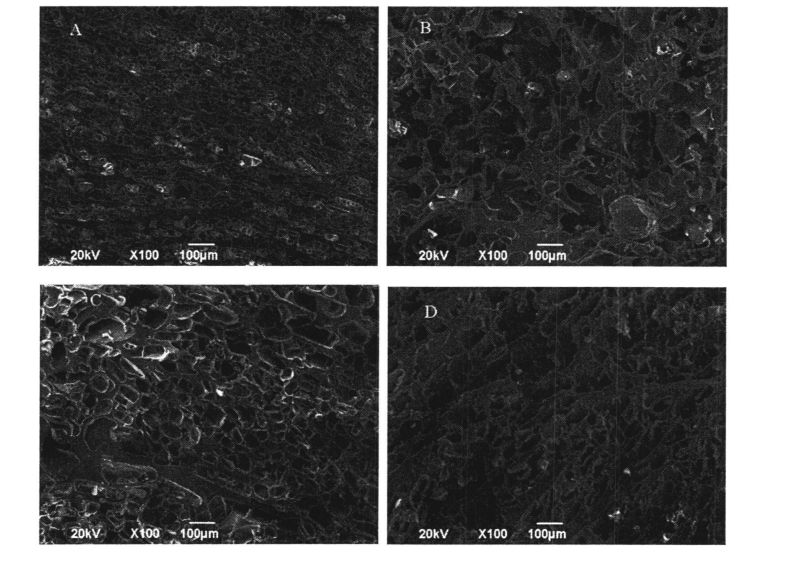
گلۇتېن خېمىرنىڭ مۈڭگۈزىدىكى 1-رەسىملىك
ئەسكەرتىش: A HPMC قوشماي, Gluten تورىنى 0 كۈن توڭلاتقۇغا ۋە توڭلاتقۇنىڭ مىكرولىنىشى. B ئەڭ توڭلىلىپ 60 كۈن توڭلىلىپلا, 60 كۈن توڭلىتىلمەيدۇ. C Gluten تورىنىڭ% 2 hpmc بىلەن 2% HPMC قوشۇلدى ۋە 0 كۈن: D بولسا يېقىشلىق تور مىكرولوم شىركىتى 60 كۈن
60 كۈن توڭلىتىلغان ساقلاش بوشلۇقى, ھۆل گلۇتېن ماسسىسى HPMC ئىشلەپچىقارماي, HPMC كۆرۈنەرلىك ئۆزگەرتىلگەن (3.7-رەسىم). 0 كۈندە, يېقىشلىق مىكرو تازىلاش نىسبىتى% 2 ياكى% 0 HPMC تولۇق شەكىلنى كۆرسەتتى
كىچىككىنە يۇمىلاق شارقىراتما مورفولوگىيەگە ئوخشاش. قانداقلا بولمىسۇن, 60 كۈن توڭلاپ ساقلانغان ساقالدىن كېيىن HLTUUTICENCE مىكرو ئېلېيىزى, مەدەنىيەت ۋە تەكشى بولمىغان, يەنى ئۆلۈشۈشتىلا «تام» نىڭ مەزمۇنىدىكى ھۈجەيرىلەر, يەنى ئۆلۈش جەريانىدا مۇز توپلاشقان جەرياندا باغدىن بىر تاشلاڭ, قۇرۇلمىنىڭ كۈچى ۋە سەمىمىيىتىدىن تەسىر كۆرسىتىدۇ. Kontogiorgos & goff (2006) ۋە Knuthoriorgos خەۋەر قىلغاندەك) ۋە KLUTGRORGOS- ۋە KLTUREGREILE نىڭ تېلېگرافلىرى توڭلىتىش سەۋەبىدىن چېقىلىپ, ئۆرلىتۇشتىن قالايمىقان پايدىلىنىپ, نەتىجىدە. 1391]. ئۇنىڭدىن باشقا, سۇ قۇيىقلۇق ۋە قويۇق قۇرۇلۇشقا توغرا كەلگەندە, بىر قەدەر قېنىق قىزىل رەڭلىك مەزمۇنلار توڭلاتقۇدا ئەركىن بۇرج مەزمۇندىكى ئەركىن تىزىملىكتە ئىشلەپچىقىرىلدى, چۈنكى قۇرامىغا يەتكەن زايومى ھاسىل قىلىنغان, چۈنكى ناتاق زايومى ھاسىل قىلىنغان, چۈنكى ناتاق زايومى ھاسىل قىلىنغان, چۈنكى ناتاق زايومى ھاسىل قىلىنغان, چۈنكى كەمسىلۈش زايومى ھاسىل قىلىنغان, چۈنكى ناتاق زايومى يارىتىلغاندىن كېيىن, Gluten قۇرۇلمىسى قىسقا ۋاقىت ئىچىدە بۇزۇلۇپ, يەنى ۋاڭ, ئۇ AS A. بىلەن بىردەك. (2014) مۇشۇنىڭغا ئوخشاش ھادىسىلەرنى كۆزىتىپ [134] قارايدۇ. شۇنىڭ بىلەن بىر ۋاقىتتا, يېمىڭلىق مىكرو ئېلېمېنت سۇ كۆچۈپ كېتىشى ۋە قايتا مەلۇم قىلىش قاتارلىقلار تۆۋەن مەيدانلۇق ۋاقىتنىڭ نەتىجىسى بىلەن ماسلاشتۇرۇلغان. TD-NMR) ئۆلچەش. بەزى تەتقىقاتلار [140, 105] دوكلات بېرىپ, گۈرۈچ روزىدىن ئارتۇق, گۈرۈچ چولئابى ۋە خېمىرنىڭ قۇرۇلما كۈچى ئاجىزلاپ كەتتى, سۇ يۆتكىلىشچانلىقى تېخىمۇ يۇقىرى بولدى. قانداقلا بولمىسۇن, 60 كۈن توڭلىتىلغان ساقلاشتىن كېيىن, غۇڭتۇننىڭ مىكرولىنىشى% 2 hpmc دىن% 2 بولدى, كىچىك ھۈجەيرە ۋە باشقىلار بىلەن تېخىمۇ كۆپ خىل شەكىللەر بىلەن گىلپىن ۋە دائىملىق شەكىلدە ئەمەس. 3.7, b, d) دىن باشقا. بۇ ۋاقىتتا HPMC نىڭ مەركىزى قۇرۇشنى ئەسلىگە كەلتۈرۈش ئارقىلىق ۋولتى قۇرۇلمىسىنىڭ بۇزۇلۇشىنى ئۈنۈملۈك توۋلىيالايدىغانلىقىنى كۆرسىتىپ بېرىدۇ.
3.4 باب خۇلاسىلەش
بۇ سىناق ساقلىنىش ساقلىغۇچ قوڭغۇرىقى (0%,% 0.5 ۋە%%%) قوشۇش ئارقىلىق ھۆل گلۇتېن ئاقلىننى تەكشۈردى (% 0.5 ۋە 60 كۈندىن%). خۇسۇسىيەت, تېرمودىنامىكىلىق خۇسۇسىك خۇسۇسىيەت ۋە فىزىكا خۇسۇسىيىتىنىڭ تەسىرى. تەتقىقاتتا بايقازلاش ساقلاش جەريانىدىكىدا, سۇ خرۇستالنىڭ بۇزۇلۇشى ۋە ئەسلىگە كەلگەن توقلغۇلارنى ئۆزگەرتىش ۋە قايتا تەقسىملەش, ئاخىرىدا خېمىرنىنىڭ ئوخشىمايدىغانلىقىنى كەلتۈرۈپ چىقىرىدىغانلىقىنى كۆرسەتتى. مەھسۇلات سۈپىتىنىڭ ناچارلىشىشى. چاسا-ئوكقنى تېجەش جەريانىدا, مۇزلاشنى سىناش نەتىجىسىدە, SLACTICUS W پروگراممىسىلىق موتېن ماسلاشتۇرۇلغان بولۇپ, HPMMC ۋە Villucss تىپىدىكى موتېن خۇلاسە ماشىنىسىنى كۆرۈنەرلىك قىلىپ, ئۇنىڭ مىكرو ئايروپىلانىنىڭ بۇزۇلغانلىقىنى كۆرسەتتى. ھەقسىز سۇلف سەللە گۇرۇپپىسى ئاساسەن كۆرۈنەرلىك ئاشتى, ئۇنىڭ گىدروبىك گۇرۇھى تېخىمۇ ئاشكارلاندى. قانداقلا بولمىسۇن, تەجرىبە نەتىجىسىدە ساقلايدىغان iPMC نىڭ پاي چېكىدە ۋە مەلۇم دائىرە ئىچىدە, بۇ كىشىنى ھەيران قالدۇرىدىغان ئۈنۈمنىڭ ئۆزگىرىشى ۋە بۇ دەرىجىدىكى نۇقساننىي ئۈنۈمى HPM قوشۇلغان. چۈنكى HPMC سۇنىڭ يۆتكىلىشچانلىقىنى چەكلەپ, تولۇق شەكىلدىكى سۇ مەزمۇنلىرىنى چەكلەپ قويۇپ, Gluten تور قۇرۇلمىسىنى ساقلاپ قالىدۇ ھەمدە Produten تور قۇرۇلمىسىنى ساقلاپ قېلىشىنى ۋە ئاقىلانىينىڭ ئورنىنى ساقلاپ قېلىشى كېرەك. بۇ فرانسىيەنىڭ NOPMC نىڭ توڭلىتىلغان خېمىر قۇرۇلمىسىنىڭ سەمىمىيىتىنى ئۈنۈملۈك ساقلايمىز, بۇ يەردە مەھسۇلاتنىڭ سۈپىتىگە ئىشىنىپ چىقىدۇ.
4-باب HPMC نىڭ توڭلىتىلغان ساقلاش مىقدارىنىڭ قۇرۇلمىسى ۋە مال-مۈلۈكلىرى سەۋەبىدىن HPMC قوشۇلۇشى
4.1 تونۇشتۇرۇش
چولپانلار مانكوس بىلەن گلۇكوزا بىلەن گلۇكوزا. ئاچقۇچ) ئىككى خىل. مىكروسكوپ نۇقتىسىدىن ئېيتقاندا, كراخمال ئادەتتە بايرام, بۇغداي چوڭلۇقى 2-10 Pro (B STRATCH) ۋە 25-35 (كراخمال). خاتكۇز قۇرۇپ كېتىش نۇقتىسىدىن قارىغاندا, كرېستلىق بومبا زىستلول رايونلىرى ۋە زرۇمسىز رايونلارنى ئۆز ئىچىگە ئالىدۇ (j ۋە c تۈرلەر), B, B, پۈتۈنلەي ھايۋانات قىلىنىشتىن كېيىن V تىپلىق). ئادەتتە, كىرىستال ۋىنكىت رايونى AMIYOPEININE نىڭ ئىز-دېرىكىشلىك بولۇپ تەركىب تاپقان, ئامورفوفوف ئاساسلىقى AMYLOSE دىن تەركىب تاپقان. چۈنكى,, C زەنجىرى (ئاساسلىق زەنجىر) دىن باشقا, ئامىنلوكتېدىڭمۇ b (تارماق زەنجىر) ۋە C (كاربون زەنجىر) خام ساز شىتاتتا «دەرەخ» دېگەنلىرىنىدۇر, بۇ ئامىلودىڭنى خام چولپاندەك. خرۇستال باغچىسىنىڭ شەكلى مەلۇم ئۇسۇلدا كىرىستال شەكىللىنىدۇ.
ستارچ ئۇننىڭ ئاساسلىق تەركىبلىرىنىڭ بىرى, ئۇنىڭ مەزمۇنى تەخمىنەن% 75 (قۇرۇق ئاساس). شۇنىڭ بىلەن بىر ۋاقىتتا, ئاشلىق كاربون ھوقۇقى بولۇش سۈپىتى بىلەن, كرەتلەرمۇ يېمەكلىكتىكى ئاساسلىق ئېنېرگىيە مەنبە ماتېرى4. خېڭە تۈزۈمدە, كلتىس ستارچ گلۇتىن ئاقسىلىنىڭ تور قۇرۇلمىسىغا ئۇلانغان ۋە قوشۇمچە قىلىنغان. بىر تەرەپ قىلىش ۋە ساقلاش جەريانىدا, چولپانلار دائىم ھايۋاناتلار باغلىنىش ۋە قېرىش باسقۇچىلارنى ئاستىغا ئالىدۇ.
بۇنىڭ ئىچىدە, چولپان ياسىتتىنلاشتۇرۇش چولپانلار توپى ۋە ئىسسىنىش شارائىتىدا تەدرىجىي تۆۋەنلەشتۈرۈلگەن جەرياندا تەدرىجىي دېكاپەت قىلىدىغانلىقىنى كۆرسىتىدۇ. ئۇ ئاساسەن ئۈچ ئاساسلىق جەريانغا بۆلۈنۈپ كېتىشى مۇمكىن. 1) ئۆزگەرمەيدىغان سۇ سۈمۈرۈلۈش باسقۇچى جىسمانى جەھەتتىن يەتكۈزۈشتىن بۇرۇن, ستارخنى ئاسما جازا ۋەقەشىدىكى كراھىزى (پاتقاللىقى) ئۆز-خۇرۇنى ئۆزگەرتەلمەيدۇ, تاشقى شەكىل ۋە ئىچكى قۇرۇلما ئاساسەن ئۆزگەرمەيدۇ. پەقەت ناھايىتى ئاز ئېرىتمىسى چولپان سۇغا تارقالدى, ئەسلى ھالىتىگە ئەسلىگە كەلتۈرگىلى بولىدۇ. 2) ئەسلىگە كەلتۈرگىلى بولمايدىغان سۇ سۈمۈرۈلۈش باسقۇچى تېمپېراتۇرا كۆپەيگەندە, سۇ چولپان خرۇستال تەركىبىدە پارچىلىنىپ, ستونچېلنىڭ توپلىمىنىڭ ماگلەكنى كەلتۈرۈپ چىقىرىپ, دارېچېر مولېكۇلا ئوتتۇرىسىدىكى كېڭەيدى. ئۇ سوزۇلغان بولۇپ, خرۇستال يوقىلىدۇ. شۇنىڭ بىلەن بىر ۋاقىتتا, ستوننىڭ بۇ بىپەرۋاپ تۇرغان بۇيۇمى يۈز بەرگەن بۇتان, مايTESE Cross Croence خېتى كۆزگە كەچۈرۈپ, يوقىتىشقا باشلايدۇ, بۇ ۋاقىتتا بۇ ۋاقىتتا تېمپۇلتۇزنىڭ دەسلەپكى ھايۋانات رايونى دەپ ئاتىلىدۇ. 3) كرېست ئۇرۇلغان پارچىلىنىش باسقۇچى ستار موكلولېس شەكىللىنىش سىستېمىسىنى پۈتۈنلەي كىرگۈزۈپ, بۇ ۋاقىتتا كتىللىق / كۋادرات بىلەن باغلىنىشلىق ھادىسە, ھايۋاناتلانغان چولپانلارمۇ α چولپان [141] دەپ ئاتىلىدۇ. خېمىر پاتقاندا, چولپاننى ھايۋاناتلاشتۇرۇش ئۆزگىچە توسالغۇ, تەمى, تەملىك, رەڭ ۋە پىششىقلاپ ئىشلەش خاراكتېرلىك ئالاھىدىلىكىنى ئوتتۇرىغا قويدى.
گراكتىكا باغقۇش ۋە ئۆزگەرتىش ئۇسۇلى مەنبە ۋە AM نىڭ مۇناسىۋەتلىك تۈرلىرى ۋە ئۆزگەرتىش شارائىتىنىڭ باشقا سىرتىدىكى ماددىلار, pH قىممىتى, تېمپېراتۇرا, تېما, تېكچۇ ماركىسى) [142-150]. شۇڭلاشقا, Starch نىڭ قۇرۇلمىسى (يەر تەۋرەش, خرۇستوللاشتۇرۇش قاتارلىقلاردا) كرايكتۈرۈش مۈلكى, لۇتېتلىشىشى مۈلكى, قېرىش خاسلىقى, ئاككاسلىنىدىغان مۈلۈك قاتارلىقلارنىڭ مۇناسىپ تەسىرلىشى مۇمكىن.
نۇرغۇن تەتقىقاتلار تەرىپىدىن بۇ تۈركۈملەپ چولپان چاپاننىڭ تۆۋەنلىگەنلىكىنى كۆرسىتىپ بەردى, قېرى ئاسان, ئۇنىڭ سۈپىتى ئاسان, مەسىلەن A1 قاتارلىق تازىلاشنىڭ ھالىتىنى پەسەيتىدۇ. (2005) بەروگوگوت چولپانلىقى سۈپىتىنىڭ ئالدىنى ئېلىش ئۈنۈمىنى تەتقىق قىلدى. Ferreero, et a1. (1993) بۇغداي ۋە كۆممىقوناق يۇلتۇزنىڭ خاسلىقىنى قاپلىغان تەسىرى [151 ياشتىن 156] نى تەكشۈردى [151-156]. قانداقلا بولمىسۇن, ئۇ ساقلاشنى كېڭەيتىشنىڭ قۇرۇلمىسى ۋە مال-تراۋانلىقى (يەرلىك كراخاچلىق) نىڭ قۇرۇلمىسى ۋە مال-مۈلۈكلىرىنى يەنىمۇ يۇقىرى ئورۇنغا قويۇش كېرەك. توڭلىتىلغان خېمىر (ئالدىن پىشۇرۇلغان خېمىرنى ئۆز ئىچىگە ئالمايدۇ) توڭلىتىلغان ساقلاشنىڭ شەرتى ئاستىدا ئىرقىيلىشىپ كەتكەن دانگېلىن شەكلىدە. شۇڭلاشقا, HPMC قوشتىكى ئانا قۇرۇلما ۋە قۇرۇلمىنىڭ ئۆزگىرىشىنى ئۆگىنىش ۋە قۇرۇلما خاراكتېرلىك خۇسۇسىيەتنى بىر تەرەپ قىلىش خۇلاسىسىنى ياخشىلاشقا پايدىلىق. ئەھمىيىتى.
بۇ سىناقتا ئوخشىمىغان HPMC مەزمۇنى (0, 0.5,% 0.5, 30 كۈندىن كېيىن, HPMC نىڭ% 1) تىقىلغان. كراخمال قۇرۇلمىسى ۋە تەبىئەتنىڭ ھايۋاناتلارنىڭ ھايۋاناتلار كۈچى.
4.2 تەجرىبە ماتېرىياللىرى ۋە ئۇسۇللىرى
4.2.1 تەجرىبە ماتېرىياللىرى
بۇغداي چولپان بىنجۇ 18-يىللىق HPMC ALADDIN (شاڭخەي) خىمىيىلىك قايتا ئىشلىدى.
4.2.2 تەجرىبە زاۋۇتى
ئۈسكۈنە ئىسمى
Hh رەقەملىك تۇراقلىق تېمپېراتۇرا سۇ مۇنچىسى
BSAL24s4s ئېلېكترونلۇق تەڭپۇڭلۇقى
BC / BD-272S توڭلاتقۇ
BCD-201L كىرىش توڭلاتقۇ
SX2.40.10 مۇپكە يەتتى
Dhg. 9070a پارتىلاش ئوچاق
KDC. 160 سائەت يۇقىرى سۈرئەتلىك توڭلاتقۇنىڭ مەركىزى
R3 ئايلىق رېشاتكىسى
مۇخبىر: 200 پەرقلىق سىكانىرلاش ئىسسىقلىق ئۆيى
D / MAX2500V تىپى X. Ray Divermractometer
SX2.40.10 مۇپكە يەتتى
ئىشلەپچىقارغۇچى
جياڭسۇ جىنت پىنتېڭ گاڭ-توڭكېڭ گوپېنوڭ تەجرىبە زاۋۇتى
Sartorius, گېرمانىيە
Haier magic
Hefei mearing co., ltd.
خۇاڭتا ئۇ تېبفېڭ تېببىي ئۈسكۈنىلەر چەكلىك شىركىتى.
شاڭخەي جخېڭ ئىلمىي ئىلمىي ۋاگېن چەكلىك شىركىتى چەكلىك.
ئەنخۇي جوڭكۈر Zhongjia ئىلمىي ئەسۋاب COO., LTD.
ئامېرىكا TA شىركىتى
ئامېرىكا TA شىركىتى
Rigaku ياساش چەكلىك شىركىتى, LTD.
خۇاڭتا ئۇ تېبفېڭ تېببىي ئۈسكۈنىلەر چەكلىك شىركىتى.
4.2.3 تەجرىبە ئۇسۇلى
4.2.3.1 Starch ئاسما ئاسما ئاسما ساقلاش بوشلۇقى
يېپىلىش كىيۇللۇق لەرلوكنىڭ ئېغىرلىقى 9 مىللىتىلما سۇ قوشۇڭ, تولۇق سىلكىش ۋە ئارىلاشتۇرۇپ,% 10 (W / W) كراخمال ئاسما تەييارلىق قىلىشنى تەييارلاڭ. ئاندىن ئۈلگە ھەل قىلىش چارىسى قويۇڭ. 18 ئۇ تازىلىق تۇرغۇزغۇچى, توڭلىتىلغان ساقلاش بوشلۇقى 0, 15 d, 30 d, بۇنىڭ 0 كۈن 0 كۈن يېڭى كونترول. ئوخشاش سۈپەتلىك يۇلتۇزلارنىڭ ئورنىغا ئوخشاش سۈپەتلىك يۇلتۇزلارنىڭ ئورنىغا,% 2 (W / W) MPMC نى قوشۇڭ, قالغان داۋالاش ئۇسۇللىرى ئۆزگەرمەيدۇ.
4.2.3.2 رىشېگولوگىيىلىك خۇسۇسىيەتلىرى
مۇناسىپ مۇزلاش ۋاقتى بىلەن بىر تەرەپ قىلىنغان ئەۋرىشكەلەرنى چىقىرىڭ, ئاندىن 4 ° C دىن ئېشىپ كەتتى, ئاندىن ئۆينىڭ تېمپېراتۇرىسىغا يۆتكەلدى.
(1) كراخمال ھايۋاناتلاشتۇرۇش ئالاھىدىلىكى
بۇ تەجرىبە كۆرسىتىشىچە, خېنلىق تېز سۈرئەتلىك تىزىملىكنىڭ ئورنىغا تېز باھا بېرىشنىڭ ئورنىغا ئىشلىتىلگەن. Bae et A1 نى كۆرۈڭ. (2014) ئازراق ئۆزگەرتىش بىلەن [1571]. كونكرېت پروگرامما پارامېتىسى تۆۋەندىكىچە ئورنىتىلى:, دىئامېتىرى 40 مىل, پەرق (GAP) 1000 مىللىمېتىر, ئايلىنىش سۈرئىتى 5 رادىئاتسىيە. I) 1 مىنۇتتا 1 ° C بىلەن قوزغىتىلدى II) 5 دە. C / Mine 95 ° C. III) 2.5 كىلومىر ئۈچۈن 95 ° C بىلەن ساقلىنىدۇ v) ئەڭ ئاخىرىدا 50 ° C دىن 5 كىچە.
ئۇنى 1.5 MLL سىزىپ, RHEMEMEMEMAMEMAMEME غا قوشۇڭ, (مىنكېماسلىق (مىنكساسلارنىڭ) ئىقرار (° C) ۋە ۋاقىتنى سۇلياۋ زەربە بېرىش ئەگەشتى سۈپىتىدە ئېلىڭ. GB / T 14490.2008 نىڭ خەۋىرىگە قارىغاندا, مۇناسىپ ھايۋاناتلاشتۇرۇش ئالاھىدىلىكى قىممىتى) ۋە BV) ۋە قايتا-قايتا قىممەت (قايتۇرۇش قىممىتى (قايتۇرۇش قىممىتى), SV), نەدە قىممەت = ئۆرلەش سالاھىيىتى - ئەڭ تۆۋەن چەكلۈك قوللىنىشچانلىقى قايتۇرۇش قىممىتى = ئاخىرقى يېپىشقاقلىقى - ئەڭ تۆۋەن تەسەۋۋۇر. ھەر بىر ئەۋرىشكى ئۈچ قېتىم تەكرارلاندى.
(2) Crowch Paste نىڭ مۇقىم ئېقىشى
يۇقىرىدا يۇيۇش سۇيۇقلۇقى ۋە Supantharaka چاپلىشىپ كەتكەنلىكى مۇقىم تارقىلىپ, پارامېتىرلار بېكىتىلدى, تارقىلىپ كەتتى, ئاياغ باھا 10 مىنۇتتا تۇرۇڭ, ۋەسىك سۈرتۈش دائىرىسى 1) 0.1 s 100s ~, 2) 100s ~. 0.1 S. ئىشلىتىش ئۈچۈن 8.0 نى ئىشلىتىپ, بۇ ئەگرى سىزىققا ئېرىشىش ئۈچۈن تىرىشىڭ ۋە باراۋەرلىكنى قىيىنلاشتۇرۇپ, تەڭرى m / = /·), ki, mi, n بولسا ئېقىن باشقۇرۇش كۆرسەتكۈچى (ئاقما ھەرىكەت كۆرسەتكۈچى (ئاقما ھەرىكەت كۆرسەتكۈچى (ئاقما ھەرىكەت كۆرسەتكۈچى (ئاقما ھەرىكەت كۆرسەتكۈچى (ئاقما ھەرىكەت كۆرسەتكۈچى (ئاقما ھەرىكەت كۆرسەتكۈچى (ئاقما ھەرىكەت كۆرسەتكۈچى (ئاقما ھەرىكەت كۆرسەتكۈچى).
4.2.3.3 چولپان چاپلاقنى چاپلاش
(1) ئۈلگە تەييارلىق
Amyloid نى ئېلىڭ ۋە (2-نومۇرلۇق سۇ بىلەن ئارىلاشتۇرۇلغان سۇ بىلەن ئارىلاشتۇرۇلغان سۇ بىلەن ئارىلاشتۇرۇڭ. 15 ° c ئۈچۈن 15 ° c دىن 30 دوللار توڭلىتىڭ. ئوخشاش سۈپەتنى يېڭىلاڭ, 1,% 2 HPMC (W / W) نى قوشۇڭ, باشقا تەييارلىق ئۇسۇللىرى ئۆزگەرمەيدۇ. مۇزلاپ تۇتۇش تاماملانغاندىن كېيىن, ئۇنى ئېلىپ, 4 سائەت 4 ° C دا ئاشۇرۇۋېتىپ, ئۆينىڭ تېمپېراتۇرىسىدا ئېرىش ماشىنىسىدا ئېرى قىلىپ ئېرىتىر.
.
ئۇنى 1.5 مىللىمېتىرلىق ئەۋرىشكە ھەل قىلىش چارىسى قىلىپ, REAPREE نىڭ ئۈلگىسىنى چىقىرىپ, يۇقىرى پەللە ئۆزگىرىپ, يۇقىرى پەللىسى يۇقىرى بولۇپ قېلىپ, سۈرئەت ئۆزگەرتكۈچنى تولۇق مەركەزلەشتۈرۈش ۋە ستارچ ھەل قىلىشنىڭ چۆكۈپ كېتىشنىڭ نارازىلىقىنى بېسىڭ, ھەمدە SiteCC ھەل قىلىش چارىسىنى تولۇق مەركەزلەشتۈرۈش. تېمپېراتۇرا سىكانىيىسى 25 ° C دىن باشلىنىپ 5 دە ئاخىرلىشىدۇ. C / min 95 ° C دىن ئېشىپ كەتتى, ئاندىن 5 مىنۇت ساقلاندى, ئاندىن 5 دىن كېيىن تۆۋەنلىدى, ئاندىن 5 ياشتىن تۆۋەن.
بىر قەۋەت سېتروتۇم يۇمىلاق ئۈستەلنىڭ چېتىگە يېنىك ئىلتىماس قىلىنغان. [1601] نىبە قىلىش ۋە رادىئاتسىيەلىك مىسالنى تىلغا ئالغان, سىزىقلىق سۈپۈرۈش 1. LVR) نى كۆرسىتىدۇ 0.01-100 بولدى, چاستوغما, چاستوتى 1 مىنۇت تۇراتتى.
ئاندىن, ئورگىنال چاستوتىسىنى سۈپۈرۈڭ, پىششىقلاش مىقدارى (سۈزۈك) (جىددىيلىكتىن ئۆتۈش نەتىجىسىگە ئاساسەن). ھەر بىر ئەۋرىشكى ئۈچ قېتىم تەكرارلاندى.
4.2.3.4 تېرمودىنامىكىلىق خۇسۇسىيەت
(1) ئۈلگە تەييارلىق
مۇناسىپ مۇزلانغان مۇئامىلىگە ئايلانغاندىن كېيىن, ئەۋرىشكە ئېلىنغان, پۈتۈنلەي ئېلىنغان, ھەمدە پۈتۈنلەي ئېرىتىلگەن بولۇپ, 48 سائەتتە ئوۋ ئوۋلىدى. ئاخىرىدا, ئىشلىتىش ئۈچۈن قاتتىق پاراشوك ئەۋزەللىكىگە ئېرىشىش ئۈچۈن يەر يۈزىگە ئېرىشىش (Xrd سىناق). Xie, et A1 نى كۆرۈڭ. (2014) Promodynadiniq 18 ° C (0, 15, 30,30 كۈن ئىچىدە توڭلاڭ. مۇناسىپ 0.5% (W / W) HPMM نى قوشۇڭ, باشقا تەييارلىق ئۇسۇللىرى ئۆزگەرمەيدۇ. مۇزلاپ ساقلاش ۋاقتى ئاخىرلاشقاندىن كېيىن, كرېستكە مىخلانغان ۋە 4 ° C دىن ئېشىپ كەتتى.
(3) ھايۋانات يېتىشنىڭ تېمپېراتۇرىسى ۋە Entry ئۆزگەرتىش
رىڭلارغا كرېستنى پايدىلىنىش قىلىپ ئېلىش, ئازوت ئېقىمى 50 مىللىمېتىر بولۇپ, 5 مىنۇتتا 5 ° C دىن ئېشىپ كەتتى, ئاندىن 5 ° C / MINT غا قىزىدى. ئاخىرىدا, ئىسسىقلىق ئېقىمى (ئىسسىقلىق ئېقىمى DW) گېلىمۇزملاشتۇرۇش چوقرىسى 2000-يىل 200. كەڭ كۆلەمدە بىرلەشتۈرۈلگەن ھەر بىر ئەۋزەللىكنى بىرلەشتۈرۈپ, كەم دېگەندە ئۈچ قېتىم تەكرارلاندى.
4.2.3.5 xrd ئۆلچەش
خەتنى باشلانغان توڭلاتال ستار ئەۋرىشكىسى 48 سائەت, ئاندىن يەرنى 48 سائەت بار, ئاندىن يەر يۈزى ۋە سېرك تالا ئەۋرىشكىسىدىن 100 لىك قىلدى. يۇقارقى ئەۋرىشكە ئېلىش, D / Max 2500V تىپلىق X. خرۇستال شەكىل ۋە نىسپىي ۋېرستاللىق X نۇرى دىئافرېنت تەرىپىدىن بەلگىلەندى. تەجرىبە پارامېتىرلىرى 40 KV, ھازىرقى 40 مايۇ, cu نى ئىشلىتىش. KS X. RAY مەنبەسى. ئۆينىڭ تېمپېراتۇرىسىدا, سىكاننلاشتۇرۇش بۇلۇڭى دائىرىسى 30-400, سىكانوكيانىڭ باھاسى 20 / مىنۇت. نىسپىي خرۇستاللىق (%) =%) = ئومۇمىي رايون چوققا ھالقىلار رايونى / ئومۇمىي رايون% 100%, ئومۇمىي رايون ئارقا-ئارقىدىن گەۋدە رايونىنىڭ يىغىندىسى [1 62].
4.2.3.6 كلاسسىك ئىششىق كۈچىنى بەلگىلەش
تولدۇرۇپ, ئېگىزلىكتە, يەر يۈزىدىن 0.1 لىك CLNTERGED سۇنى قوشۇڭ, ئۇنى ياخشى سىلكىڭ, ئۇ يەردە مۇقىم تېمپېراتۇرادا تۇرايلى. 30 مىنۇتتىن كېيىن, ھايۋاناتنىلاشتۇرۇش تاماملىنىپ, مەركەزلىك رەينىنى بېسىپ, تېز سوۋۇتۇش ئۈچۈن ساياھەت مۇنچىسىغا قويۇڭ. ئاخىرى, مەركەزلىك قاقتى-كۈن 5000 RPM, ھەددىدىن زىيادە ھەددىدىن زىيادە ھەددىدىن زىيادە ھەددىدىن زىيادە زىيان تارتقان. ئىششىق قۇۋۋەت = ھەۋەس شەكلىدىكى ماسسا / ئەۋرىشكە ماسسا [163].
4.2.3.7 سانلىق مەلۇمات ئانالىزى ۋە بىر تەرەپ قىلىش
باشقىچە بەلگىلەنمىگەن بولمىسا, بارلىق تەجرىبە كەم دېگەندە ئۈچ قېتىم تەكرارلاندى, تەجرىبە نەتىجىسى سىزنىڭ مەنىسى ۋە ئۆلچەملىك چېكىنىشى سۈپىتىدە ئىپادىلەنگەن. SPSS StatiStic 19 پەرقنى تەھلىل قىلىشقا ئىشلىتىلگەن (ئوخشىماسلىق, AniAs, Atova) نى قىممەتتىن 0.05. باغلىنىشلىق دىدتلىرى 8.0 نى ئىشلىتىپ چىقىرىۋېتىلدى.
4.3 تەھلىل ۋە مۇنازىرە
4.3.1 بۇغداي چولپانلارنىڭ ئاساسلىق زاپچاسلىرى مەزمۇنى
GB 50093.2010, GB / T 5009.9008, GB 50094.2010, بۇغداي ستالىچ - نەملىك / ئامىللىق ۋە كۈل مەزمۇنى ئىدارىسى بېكىتىلدى. بۇ نەتىجە 4-جەدۋەلدە كۆرسىتىلدى. 1 كۆرسىتىلدى.
بۇغداي چولپىنىنىڭ تەركىبلىرىنىڭ 80 مەزمۇنىنى چېكىڭ
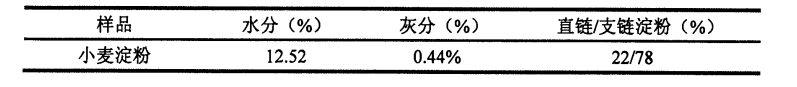
4.32-نومۇرلۇق HPMC قوشۇلۇش نىسبىتى, بۇغداي چولپىنىنىڭ ھايۋاناتلار باغلىنىشىدىكى ساقلاش ۋاقتى
كراخمالنى جاراڭلىق قىلىش ئۈچۈن مەلۇم مەركەزلەشتۈرۈش توختىتىش پائالىيىتى بىلەن بىر ئېنىق مەركەزلەشتۈرۈش توختىتىلغان. گېرماننىي جەھەتتىن باشلانغاندىن كېيىن, Turbid سۇيۇقلۇقى چولپانلارنىڭ كېڭىيىشىدىن ئاستا-ئاستا يۇيۇنۇپ, تەسەۋۋۇر ئۇكرائىنانىڭ ئۇدا ئۆرلىشى ئۈزلۈكسىز كۆپەيدى. ئۇنىڭدىن كېيىن, STARCH Granules يېرىلىش يېرىلىش ۋە يېپىشقاقلىق دەرىجىسى تۆۋەنلەيدۇ. قاپىقى بەزى سوۋغات بېرىش نىسبىتىدە سوۋۇغاندا, چاپلاش Gel ۋە تەسەۋۋۇر قىممىتى تېخىمۇ ئالغا ئىلگىرىلەيدۇ. ئۇ 50 سېلسلىق قىممىتى ئەڭ كۆپ بولغاندا 50 ° C غا يېتىۋاتقاندا ئەڭ ئاخىرقى يېپىشقاق قىممەت (4.1-رەسىم).
جەدۋەل 42-جەدۋەلدە يېگانە خاراكتېرلىك چولپانلاشتۇرۇش ياساش ئۇقۇمى, تۇتاش خاراكتېرلىك مەنىلەر سىكانىرلاش, ئەڭ جەلپ قىلىش كۈچى, ئەڭ جەلپ قىلىش قىممىتىمۇ ۋە مىننەتدارلىق بىلدۈرۈشنىڭ ئەڭ تۆۋەن نۇقتىسى ۋە كاتەكنىڭ مۆلچەرىدە HPMC قوشۇلغان ۋە ئېچىشنى ئەكس ئەتتۈرىدۇ, HPMC قوشۇلۇشنى ئۆز ئىچىگە ئالىدۇ. خىمىيىلىك خۇسۇسىيەتنىڭ تەسىرى. تەجرىبە نەتىجىسى, مۇقكۇق ساقلاش ئورنى, HPMM نىڭ ئېشىش كۈچى ۋە ئەسلىگە كەلتۈرۈش قىممىتى كۆرۈنەرلىك تۆۋەنلىدى. كونكرېت قىلىپ ئېيتقاندا, يۇقىرى سەپلىمىلىرى 727.51 +% 0.511 بولغان (IPMC نى قوشقاندا) بارلىقى (146.66.63.63 كود (946.66 (% 2.63 كود) قوشۇلىدۇ (% 2.63.c (% 2.63 كود)). ئەڭ تۆۋەن سەھىپە 484.95 + 18.97 + 18.97 + لىق قوشقلغۇچە% HPMC), 555.5.5.5 (533.03 + 533.57 + (23.03; 6.57.57.c (% 2 hpmc) نى قوشۇڭ. ئەڭ ئاخىرقى مۇتەخەسسىسلەر 794.62.612818 دىن 8.5.25.24, 846.04 + ±% 1% HPMC) (% 1.884-34.57.c (% 2 hpmc نى قوشۇشى) قانداقلا بولمىسۇن, بۇ خىل ئېھتىياجنىڭ قوزغىتىش قىممىتى تۆۋەنلەپ, 336.64.264-11 دىن 303.564-11 دىن 303.564-11 دىن 303.52.21 دىن تۆۋەنلىچە 303.52.c (324.11 يۈەن), 324.19 ± 2.54 cp (قوشۇش
% 1 hpmc) بىلەن 393.614-45.94 + 14.29 + 14.59 + 14.50 + 6.13-4.31.31.31.34-4.31.39 + 67.85 + 21.83 قوشۇلدى). بۇ ۋە ACHAYTUKAN & PushenthahaKa نىڭ خەۋىرىگە قارىغاندا, ئاكشاتاخارا ۋە Peiang (2008) ۋە خۇاڭ) قاتارلىق گىگانتاخاراينىڭ قوشۇلغانلىقىنى ۋە خۇاڭ) يۇلتۇزنىڭ ھايۋاناتلارنىڭ گېكەتنىڭ ھايۋاناتلارنىڭ زەربە سىڭىيىشىنى ئاشۇرالايدۇ. بۇ بەلكىم HPMC نىڭ بىر خىل بىلەن ھىدرومىشى بىلەن ھەرىكەت قىلىدىغانلىقى ئۈچۈن, ئۇنىڭ ياندىكى زەنجىردىكى گىلروفىل تىلىدىكى سۇچۇنبىزنىڭمۇ سىرتتىكى راكېزشىنى ساتتى. ئۇنىڭدىن باشقا, HPMC نىڭ تېبىل دېمىسىنىڭ تېبىلاسى (نەتىجىدە) تېمپېراتۇرا (نەتىجە) دىن چوڭ, شۇڭا HPMC نىڭ چولپان رەنجىش كېسىلىگە گىرىپتار بولۇش سەۋەبىدىن HPMC نىڭ قالايمىقانچىلىق كۈچىدىن زور دەرىجىدە تۆۋەنلىتىشىدىن. شۇڭلاشقا, كرەنىك يۇلتۇز مېۋىلەشتى ۋە ئاخىرقى تەستىقىدىن ئاستا-ئاستا HPMC مەزمۇنىنىڭ ئۆسۈشى بىلەن ئۆرلىدى.
يەنە بىر تەرەپتىن, HPMC نىڭ سوممىسى ئوخشاش, ھاۋات زاۋۇتى, ئەڭ جەلپ قىلىش كۈچى, ئەڭ يېڭى كۈرەش قىلىش قىممىتى, ھەل قىلغۇچ مۇسابىقە پەسلى يۇقىرى داۋاملاشتى. بولۇپمۇ HPMC نىڭ HPMC توختاپ Hpmc ئاسقاقسى چۈشۈپ كەتكەن ئاسما ئاسما كېسەلنىڭ يۇقىرى قاتماللىقىدىكى يۇقىرى پەللىنىڭ كۆرسەتكۈچى (توڭلاتقۇ ساقلاش) دىن 1584.04 + 68.11 (توڭلىتىلغان ساقلاش 60 كۈن) % 0.5 يۇقىرى سۈرئەتلىك چۈشلۈك تاماقخانىسىنىڭ چوققا تىرانسپورتى% HPMC دىن يۇقىرى سەپتىكى يۇقىرى پەللىگە كۆتۈرۈش% 718.8214-114-48.824-44-7 دىن 1415.83-7.75.c (60 كۈن توڭلىتىش). كاتەكچى ئاسما ئاسما ئاسمىنى ئاسما ئاسما ئاسما سۇيۇق كاتەكچە سۇيۇقلۇقىنىڭ چولپان سۇيۇقلۇقىنى 899.55.c (Signe Create "دىن 1298.19- ± 78.13 CP (60 كۈنلۈك ساقلاش) CLACC ئاسما ئاسما ئاسما ئاسما ئاسما ئاسما ئاسما ئاسما ئاسما ئاستامىن ئاسمىنى 946.64 ± 9.63.c (9 كۈنلۈك توڭلىتىلغان 0 كۈن) 1240.224.94.06 cp (60 كۈنلۈك نۇقتا) كە يەتتى. شۇنىڭ بىلەن بىر ۋاقىتتا, HPMC كېسىش رېكورتى تۆۋەنلىتىشنىڭ ئەڭ تۆۋەن ئالاھىدىلىكى 396.7-4 7.96.7-.77 دىن 556.77 دىن 556.77 دىن 556.77 (60 كۈن توڭلىتىش). % HPMC بىلەن ئاسما ئاسما ئاسما ئاسما ئاسما ئاسما جازانىڭ ئەڭ تۆۋەن سەزگۈسى 654.954.90 CP (0 كۈنلۈك نۇرىغا يېتىڭ) 581.93-72.23.22 Cp (60 كۈن داۋاملاشتۇرۇڭ). بۇ خىل خلانما ئاسما ئاسما ئاسما تىپتىكى HPMC 485.564.564-564-56.05.c (0 كۈنلۈك چاققا يېتىڭ 625.484-67.17 cp (60 كۈن توڭلىتىش) دىن (نۇقتا يېتىڭ) كۈز ئاسما ئاسما جازادا% 2 HPMC CP (0 كۈنلۈك 0 كۈنلۈك سۇنۇق) 6823.57.c (0 كۈنلۈك تۈزۈم) 682.58 ± 20.29 CP (60.29 CP).
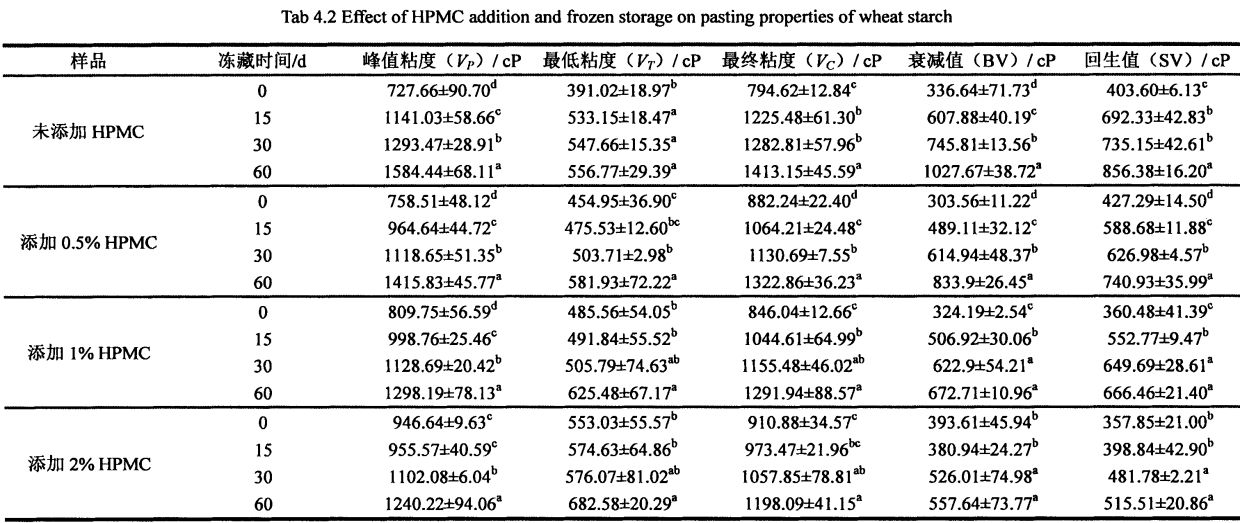
HPMC توختاپ HPMC چۈشۈپ HPMC دىن HPMC چۈشۈپ كەتمىگەندە HPMC نىڭ ئەڭ ئاخىرقى تەسۋىرى (تېز ساقلاش 0 كۈنلۈك 413.15 دىن 1413.15 cp (توڭلىتىلغان ساقلاش 60 كۈن). چولپان ئاسما ۋەقەنىڭ ۋاقىت چەكلىمىسى 882.24 دىن ئېشىپ كەتكەن بولۇپ, ئەتىگەن سائەت 0 كۈنلۈك ساقلاش) دىن 1322.8.86 دىن 1322.86 گە يەتتى. 20 كۈنلۈك ساقلاش) چولپان ئاسما ئاسما ئاسما قېپىنى% 1 HPMC بىلەن 1.66.04 ± 12.66.94.94.94 ± 88.94 ± 89.004 ± 89.94. كراخان ئاسما ئاسما چوققا ئاسما چوققا سىلغۇسى 91 0.88 ± 34.57 cp
(توڭلىتىلغان ساقلاش 0 كۈن) 1198.09 ± 41.109 ± 41.15 CP (توڭلىتىلغان ساقلاش 60 كۈن). مەلۇمھۇغا قەدەر, HPMC نى قوشماي تۇرۇپلا چولپان تېرىلغۇ بولۇشنىڭ مەركىزىدىكى قىممىتى 336.64.64.c دىن 1027.67 (توڭگال ساقلاش 60 كۈن) دىن 1027.67 ± 327.67 0.5 نى قوشقان نىسبىتى% HPMC نىڭ% HPMC نىڭ% HPMC نىڭ مەركىزىدىن بىرلىشىش قىممىتى 3033.260 (توڭلىمە ساقلاش 0 كۈن) دىن 833.95 (توڭلاتقۇ ساقلاش 60 كۈن) كراخمال ئاسما ئاسما ئاسمىدى قېزىشنىڭ سۇيۇقلۇقنىڭ% 1 ± 14.19 ± 2.54.19 ± 2.54 نومۇرلۇق نىسبىتى (0 دىن ئېشىپ 672.7 دىن 672.71 دىن 672.91 دىن 672.91 دىن 672.97 دىن 672.91 دىن 672.91 دىن 672.96.96.c (60 كۈن توڭلىتىش) ئاس كلاستىكى ئاسما ماشىنىنىڭ% 2 ى 59.94.61 دىن 55.94.61 دىن 557.64 دىن 557.64 دىن 557.64 دىن 557.64 دىن 557.64 دىن 557.64. HPMC بولمىسا HPMC ئاسما ئاسما توختىتىلىش قىممىتى 403.60 ± 6.13 c
P (توڭلىتىلغان ساقلاش 0 كۈن) دىن 856.38 ± 16.20 CP (توڭلىتىلغان ساقلاش 60 كۈن) چولپان ئاسما ئاسما ئاسما قىممىتى 427 .29 ± 16.50 CP (توڭلىمە ساقلاش 0 كۈن ئىچىدە) 740.99 C (60 كۈنلۈك) ستار ئاسما ئاسما جازانىڭ قايتا ھېسابلاش قىممىتى ئاران% 1 HPMC دىن% 1 ± 41 ئاشتى. 39 CP (توڭلىتىلغان ساقلاش 0 كۈن ئىچىدە) 666.46 ± 21.40 CP (توڭلىتىلغان ساقلاش 60 كۈنلۈك) ستارەت ئاسما ئاسمانىڭ قايتا ھېسابلاش قىممىتى بىلەن% 2 HPMC بىلەن% 2 HPMC بىلەن تەڭتىرى بولدى 357.85 دىن ئېشىپ كەتتى, تەخمىنەن 21.00 CP (توڭلىتىلغان 60 كۈن). 0 كۈن) 515.51 گە يېتىدۇ, 515.51 ± 20.86 CP (60 كۈن توڭلىتىلغان).
مۇز يۇلتۇزنىڭ ئۇزۇنغا سوزۇشى بىلەن شۇنى كۆرگىلى بولىدۇكى, چوڭىيىش ساقلاش ۋاقتىنى ئۇزارتىشىغا, كرەنىك ۋىتازلاشتۇرۇش ئالاھىدىلىكى ئاشتى, بۇلارنىڭ Tao قاتارلىقلار تا قاتارلىقلار بىلەن بىردەك. F2015) 1. تەجرىبە نەتىجىسىگە ماس كېلىدىغان, ئۇلار پىۋا-تۇتۇشنىڭ ئوخشىمىغان دەرىجىدىكى بارلىق ئۆزگىرىشلەر, چىملىقنىڭ ئەڭ تۆۋەن دەرىجىدىكى ئەڭ تۆۋەن دەرىجىدىكى ۋەھىيلىرى ۋە 166 يەھۇدى. ئاساسلىقى توڭلىتىش رايونىدا, Akorphous (AMROphOus رايونى) باسقۇچىدا (ئاساسلىق تەركىب) ھادىسە (يەرسىز) ھادىسە, ئايرىلغانلىق كېسىلىش ۋە چولپانلارنىڭ توختىتىلىشىنىڭ كۆپىيىشىگە ئەگىشىپ) ستاراچ ھايۋاناتلاشتۇرۇش ۋە مۇناسىۋەتلىك كەسكىنلەش قىممىتى ۋە ئەسلىگە كەلتۈرۈش قىممىتىنى ئاشۇرۇش. قانداقلا بولمىسۇن, HPMC نىڭ RAPMC نىڭ Starch قۇرۇلۇشى توغرىسىدىكى مۇز كىرىمىنى جەلپ قىلغان. شۇڭلاشقا, ھامىلىدىكى سەھى ئىتتىپاقى, ئەڭ جەلپ قىلىش كۈچى, ئەڭ يېڭى كۈرەش قىلىش نىسبىتى رېلونت قىلىش نىسبىتى توڭلىتىشنىڭ قىممىتى ۋە قايتا قوزغىتىش نىسبىتى ئاشتى. تەرتىپلىك كۆپەيتىش ۋە ئازايتىش.
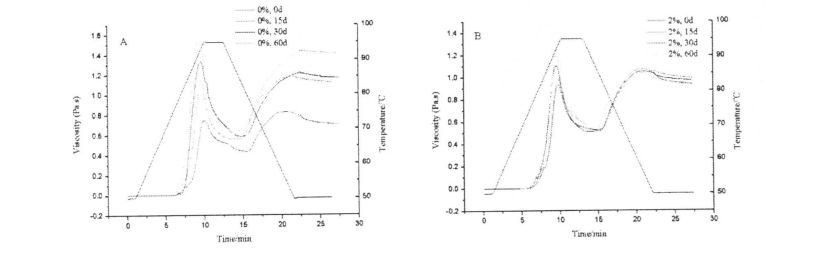
1-رەسىم
4.3.3 HPMC قوشۇلۇشىدىكى HPMC قوشۇلۇشى ۋە Starch Pastice نىڭ شېغىردىكى Starch نىڭ Starch Starsity ساقلاش ۋاقتى
سۇيۇقلۇقنىڭ روشەن باھا (Mear Sisceity) نىڭ ئۈنۈمى تەكشۈرۈلگەنلىكىنى ۋە سۇيۇقلاندۇرۇش ماتېرىياللىرى ۋە سۇيۇقلانتىرا ماتېرىيال قۇرۇلۇشى ۋە مال-مۈلۈك جەھەتتە كۆرۈلدى. 4.3 جەدۋەل ماسلاشتۇرۇلغان, يەنى, كونسېرتلىق كوئاپەتلۈك دەرىجىسى ۋە ئېقىمى rpmc ۋە يۇقىرىدىكى پارامېتىرلارنىڭ تەسىرىدە KPMC ياكى توڭلىتىش ۋاقتى k gate نىڭ تەسىرى
1-رەسىم HPMC (A) ياكى% 2 HPMC (B) بىلەن
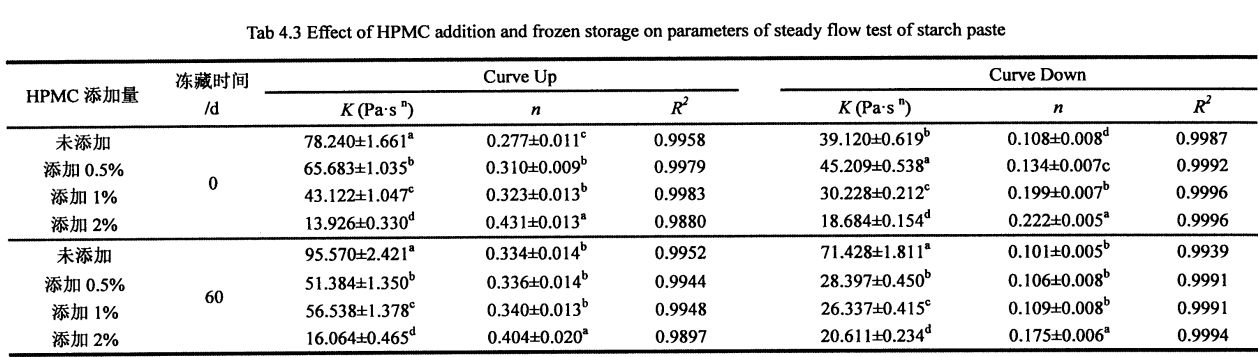
4.3-جەدۋەلدىن كۆرۈۋېلىشقا بولىدۇكى, بارلىق ئەقلىي ئىقتىدارلىق تەسىرلىك كۆرسەتكۈچ نۇقتىلارنى كۆرگىلى بولىدۇ. شۇڭا چولپانلار پولشا چاپلىيا, بارلىق دېڭىزدىكى ھادىسىلەرنىڭ كۆپىيىشىدىن, پۈتۈنلەي تۆۋەن ياكى سۇيۇقلۇقنىڭ MedCoss نىڭ شېكىك كۆرسۇن. ئۇنىڭدىن باشقا, شېھ% سايىل-ئايرىم ھالدا 0.1 s لىق. 1 100 S ~ غا كۆپەيدى, ئاندىن 100 دىن سېتىۋالغان ئۆستەڭنىڭ تولۇق تۆۋەنلىشى ۋە ماس كېلىدىغانلىقى ئوخشاش بولمايدۇ, شۇڭا كرېنس چاپان (HPMC چاپلانغان ياكى توڭلىتىش ياكى ئەمەس). قانداقلا بولمىسۇن, ئوخشاش توڭلىتىش ۋاقتىغىمۇ, HPMC دىن باشقا, ماس قەدەمنىڭ TW N نىڭ پەرقى ئاستا-ئاستا كۆپىيىدۇ, بۇنى HPMC نىڭ پېشقەدەملىكى پېچىنە بېسىمى ئاستىدا. ئۇ ھەرىكەت ئاستىدا نىسبەتەن مۇقىم بولۇپ, «Thixtropk ئۈزۈكنى ئازايتىدۇ».
(Thixotropic loop) رايونى, بۇ ۋە As1 قاتارلىقلار. (2005) ئوخشاش خۇلاسە خەۋەر قىلىندى [167]. بۇ بەلكىم يۇقىرى بولۇشى مۇمكىن, چۈنكى HPMC بىلەن ھايۋاناتلار باغلانغان كراخمال زەنجىرلىرى (ئاساسلىقى amylose ۋە ئامىئود ۋە ئامىيودېنى قىرغاق ۋە ئامىيودىدىن ئايرىلىش. , شۇڭا قۇرۇلمىنىڭ نىسرىنىڭ ئاساسى مۇقىم مۇقىملىقىنى ساقلاپ قېلىش ۋە بىرلىككە كەلتۈرۈشنى ساقلاپ قېلىش ئۈچۈن, ئەگرى سىزىقنىڭ مۇتلاسى ۋە شېكىل بېسىمىغا ئوخشايدۇ).
يەنە بىر تەرەپتىن, چولپان ساقلاش بوشلۇقىنى ئويلىمىغان يەردىن, 78.240 ± RPMC دىن 2.6240 ±) نى ئايرىم-ئايرىم ھالدا 65.240 ±). 683 ± 1.035 ئەگن (% 0.30 mpmc a) نى قوشۇڭ, 13.926 ±, N قىممىتى% 2.27 ± 0.011 ± 0.011 ± 0.07 ± 0.011 ±. 310 ± 0.00 ± 0.0,9 (323 ± 0.% 1.013 (2008) ۋە تۇخۈنبۇكقا ئوخشايدۇ), 43 1 ± 0.0 1 3 ± 0.0 1 ± 0.0 1 ± (2008), 2011-يىللىقنىڭ قىممىتى ۋە نىكمىن) غا ئوخشايدۇ. HPMC نىڭ سۇيۇقلۇق فېدوپوپلللللوكرانتلىق ئېنېرگىيىسىگە نىونوپللورىيەدىن يېڭىدىن ئۆزگەرتىشكە ئۈمىدۋار قىلغان. شۇنىڭ بىلەن بىر ۋاقىتتا, ستون سېلىنغاندىن 60 كۈن توڭلىتىلغان, K, N قىممىتى HPMC قوشۇش بىلەن بىر ئۆزگىرىشچانلىقىنى ئوتتۇرىغا قويدى.
قانداقلا بولمىسۇن, يېقىشلىق ساقلاش ۋاقتىنى بىلدۈرۈشنى, K بىلەن n K بىلەن n K بىلەن n نىڭ قىممىتى ئايرىم بەلگىلىمە بويىچە) ئايرىم-ئايرىم ھالدا 78.240 ± 07 دىن 95.540 ± 1. 2.421 Paon (6663 ± 1,63 ±% 535 Pa ±% 54.5 دىن% 5 گىچە بولىدۇ, 60 كۈن ئىچىدە RPMC (1 كۈن) ئۆرلەپ, 0 كۈنلۈك HPMC, 0 كۈن. 56.538 ±% 1.330 HPMIN (% 2.30 HPMC, 04.465 bon (% 2 bpmc, 60 كۈنلۈكنى قوشىدۇ) 0.277 ± 0.014 (HPMC, 0 كۈن ئىچىدە HPMC (0.014 (% 0.51) 0.014 ± 0.0 HPMC, 0 كۈن) 0.040 ± 0.013 (60 كۈن% HPMC نى قوشۇڭ, 60 كۈن ئىچىدە) 0.431 ± 0.013 ($ 1 دىن 1.013 + HPMC, 0 كۈن) دىن 0.404 + كېلىدۇ (% 2 HPMC, 60 كۈن) قوشۇڭ. سېلىشتۇرۇپ بېقىڭ, HPMC نىڭ قوشۇلما قىممىتى ئارقا-ئارقىنىڭ كۆپىيىشىتسەك بولىدۇ, سىز CPMC نىڭ قىممىتىنىڭ ئۆزگىرىشىنىڭ ئۆزگىرىشى ئوت-چۆپ ياساش ھەرىكىتىنىڭ ھەرىكەتلەندۈرگۈچ كۈچى ئاستىدا مۇقىم ھالەت تۇتىدۇ. ئىزچىل.
4.3.4 HPMC قوشۇلۇشى ۋە Starch Paste نىڭ ھەرىكەتچان VistoseLafice نىڭ ھەرىكەتچانلىقى توغرىسىدىكى ساقلاش ۋاقتى
ھەرىكەتچان چاستوتا سۈيى بۇ ماتېرىيالنىڭ VISCO نى ئۈنۈملۈك ئەكس ئەتتۈرۈپ, كاتتا پرايىمانچىلىكىنى ئۈنۈملۈك ئەكس ئەتتۈرىدۇ, بۇ ئۇنىڭ مايلىق كۈچى (گېلى قۇدرى) نى تەسۋىرلەشكە ئىشلىتىلىدۇ. 4.3-رەسىم 4.3 خىل HPMC قوشۇلۇشى ۋە توڭلىتىش قوزغاتقۇچنىڭ ئۆزگىرىشىنى كۆرسىتىدۇ.
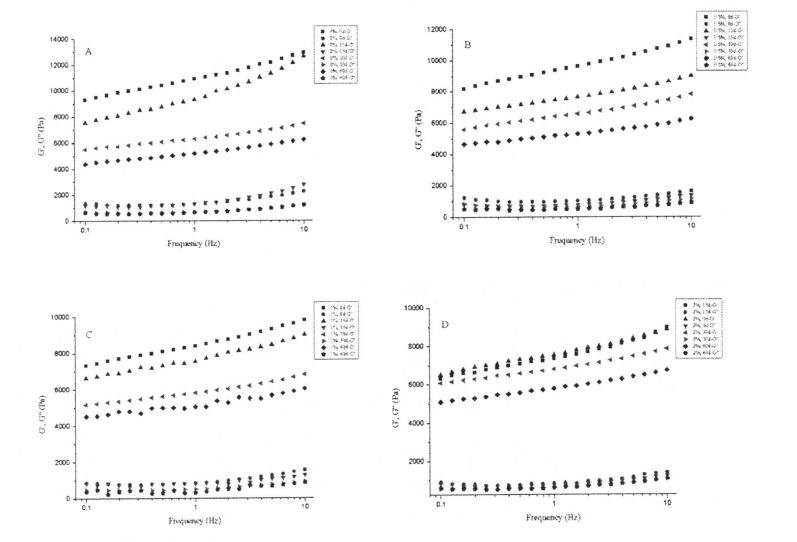
43-رەسىملىك
ئەسكەرتىش: بىر ۋە مۇزنى تازىلاش ۋاقتىنى كېڭەيتىش بىلەن ئۆز-ئارا مۇناسىۋەتلىك HPMC STARCH نىڭ ViscoELASHTISTILE نىڭ ئۆزگىرىشى B رادىئويونىڭ قوشۇلۇشىدىن 2.% HPMC ستارتورنى ئۆزگەرتىش بىلەن% 5 hpmc چولپىنىنىڭ ئۆزگىرىشى بىلەن 5% HPMC CRARCH نىڭ ئۆزگىرىشى C بولسا تېخىمۇ چوڭ ساقلاش ۋاقتىنى ئۇزارتىش بىلەن ViscookSheLicate نىڭ ئۆزگىرىشى. D بولسا توڭلىتىش ۋاقتىنى ئۇزارتىش بىلەن 2% HPMC كرىزىسىنىڭ ئۆزگىرىشى
ستارخان ھايۋاناتلاشتۇرۇش مۇساپىسى كرېدىچ چېنۇلانىڭ ئايرىلىش بوغىغا ھەمراھلىقى بىلەن ھەمراھ بولدى, كرەت زەنجىر باغچىسى, كراخباراتچىلىق) جىسمانىي جەھەتتىن كۆۋرۈك ھاسىل قىلىدۇ. 4.3-يىلى رەسىمدە كۆرسىتىلگەندەك, HPMC غا كۆرۈنەرلىك قارىتا كۆرسىتىلگەندەك, HPMC نىڭ كۆرۈنەرلىك پەرقىدىن ئېشىپ كەتتى, بۇ ۋاقىتتا HPMC بىلەن بولغان ئېھتىياج سەۋەبىدىن, GPMC ياكى HPMC بىلەن بولغان چوققىسىنىڭ سۈيىنى يوقىتىدۇ. ئوخشاش) ۋاقىت, چاكاۋاڭ ۋە Pushentharaka (2005-يىلدىن): شۇ يەردىن گارەك خان جەمەتى كرەت قوتاننىڭ بۇزۇلغان چولپان (بۇزۇلغان چولپان) كراخمال ياسىغان ۋە ئۆتكەندىن كېيىن ئۆز-ئارا باغلىنىش دەرىجىسى تۆۋەنلەيدۇ. مۇقىملىق ۋە ئىخچام بولۇشنىڭ جىسمانى جەھەتتىن «خالئاراشماقتا» (مىكروسكوھنىڭ نىسپىي خرۇستاللىقى) نىڭ ئورۇنلاشتۇرۇلۇشى, ئاساسلىقى AMyLectE دىن ياسالغان, نەتىجىدە AMICELELEN SANINGATUCT) نى كۆپەيتىپ, شۇنىڭ بىلەن بىر ۋاقىتتا مولېكۇلاسى زەنجىربېشىدىن كېيىن, مولېكۇلاسى زەنجىرىنى تۆۋەنلىتىدۇ (مولېكۇلاق زەنجىراسى), ئاخىرى STECHY Grol قۇچىسىنىڭ تۆۋەنلىشىنى كەلتۈرۈپ چىقاردى. قانداقلا بولمىسۇن, HPMC بۇنىڭدىن باشقا, G 'باسىلاش نىسبىتى تۆۋەنلەش, بۇ ئۈنۈمى HPM قوشۇلغان. بۇ يانفوننىڭ قوشۇلغانلىقىدىن بېرىلگەندە, HPMC نىڭ توڭلىتىلغان ساقلاش شارائىتىدىكى تېررورخورما ۋە خرۇستالنىڭ ئىشلىتىلىشىگە تاقابىل تۇرسا بولىدۇ.
4. IPMC قوشۇلۇش نىسبىتى I-IPMC قوشۇلۇشى ۋە ستارلېش ئويۇنىدىكى ساقلاش ۋاقتى
ستارنىڭ ئىششىق نىسبىتى ستار يۇلتۇز يۈش نىسبىتى ۋە ئىشكاپىنىڭ چوڭ-كىچىكلىكىنى ئەكس ئەتتۈرەلەيدۇ, مەركەزلىك مەھەللە شارائىتتا مۇقىملىقىنى ئەكس ئەتتۈرەلەيدۇ. 4.4-رەسىمدە كۆرسىتىلگەندەك, HPMC نىڭ ئۆسۈپ يېتىلىدەك, HPMC نىڭ ئۆسۈپ يېتىلىشنىڭ كۆپىيىگەندە, HPMC نىڭ ئىشسىز بولۇشى) usgank (0.099 ھايۋاناتلاشتۇرۇش ئالاھىدىلىكى. قانداقلا بولمىسۇن, توڭلىتىلغان ساقلاش ۋاقتىنى ئۇزارتىش ئۈچۈن, STARCH نىڭ ئىشارەت ھوقۇقى تۆۋەنلىدى. 0 كۈنلۈك توڭلىتىش ماشىنىسىغا سېلىشتۇرغاندا, ستارخنىڭ ئىشلىشى ئومۇمىي قىممىتى 8.969-A..999 دىن 7.057 + 0 دىن 7.057 + 0 گە 60 كۈن بۇرۇن. .007 (HPMC يوق), 97 + 0.147 دىن 32.269-2-47 + 0.184 + 0.182 + 0.282 + 0.282 + 0.282 * دىن تۆۋەنلىدى. 9.282 نەتىجىدە, مۇزلۇق ساقلاش بوشلۇقىدىن كېيىن ستارك دان-داچېلنىڭ بۇزۇلغاندىن كېيىن بۇزۇلغان, ھەل قىلغىلى ئۆرلەش خورچاڭ ۋە مەركىزىنىڭ قىسقىچە مەزمۇنىنى كەلتۈرۈپ چىقاردى. شۇڭلاشقا, سترەتچىنىڭ چىرىغىسى ۋە سۈپاسلىشىش كۈچىنىڭ تۆۋەنلىدى. ئۇنىڭدىن باشقا, كەراتلۇق ساقلاشقا, كرەپتلىق يۇلتۇز پالاتقۇچ پالتتىسى, ئۇنىڭ مۇقىملىق ۋە سۇ ساقلاش ئىقتىدارى تۆۋەنلىگەن, ئىككەيلەننىڭ ئۆسۈپ مەيدانىنىڭ دۆلەت گۇرۇھى [171]. يەنە بىر تەرەپتىن, HPMC نىڭ كۆپىيىشىدە, ئۇلان چولپان يېرىلىشنىڭ ئۆسۈشى بىلەن, ئۇستىش ئىش قىلىش كۈچىنىڭ تۆۋەنلىشى ئاستا بولۇپ, HPMC ساقلانمىلارنى توڭلىتىش ۋە كلاسسىيىلىك دان تېرىنىڭ سوممىسىنى ئازايتالايدىغانلىقىنى كۆرسىتىپ بېرىدۇ.
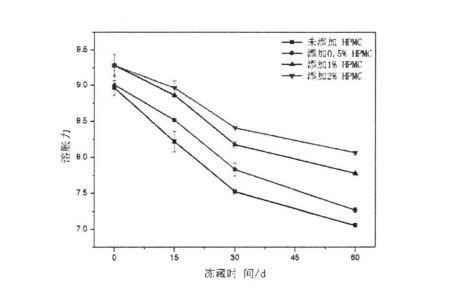
1-رەسىمدىكى CPMC قوشۇشنىڭ ئۈنۈمى ۋە توڭلاتقۇنىڭ ئىششىق ئېنېرگىيىسىدىكى ساقلاش كۈچى
4.3.6 HPMC قوشۇلۇشىنىڭ ئالدىنى ئېلىش ۋاقتى
چولپاننىڭ ھايۋاناتنى ئارىلىشىشنىڭ ئىچكى خىمىيىلىك خىمىيىلىك تېرمودىنامىكىلىق جەريان. شۇڭلاشقا, DSC دائىم ئاخىرلاشقان تېمپېراتۇرىسى (ئۆتىلگەن), ئاخىرلىشىش تېمپېراتۇرىسى (a), ئاخىرلىشىش تېمپېراتۇرىسى (T. T.) ۋە ھايۋاناتنىلاش ئېلخېتىنلاشتۇرۇش. (TC). جەدۋەل 4.4 جەدۋەلنىڭ DSC نىڭ DSC ئەجپىياتىنى كۆرسىتىدۇ, ئوخشىمىغان توڭلىتىش ساقلاش ۋاقتى ئۈچۈن HPMC قوشۇلغان DPMC قوشۇنى كۆرسىتىدۇ.
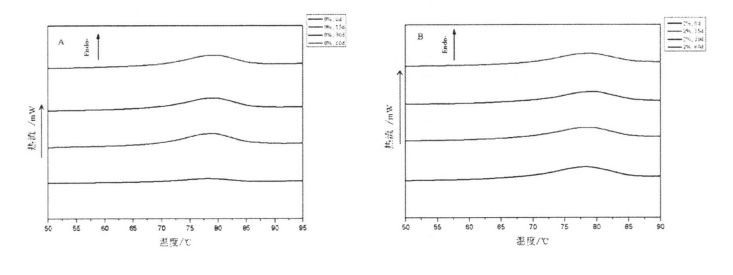
UPMC قوشۇشنىڭ 4.5 نىڭ ئۈنۈمى, بۇغداي چولپىنىنىڭ ئىسسىقلىق خانقىزى
ئەسكەرتىش: A HPMC ۋە HPMC نى قوشماي, HPMC ۋە توڭلاتقۇ ۋە توڭلاتقۇ ۋە توڭلاتقۇنىڭ DSCгаز ئەگرى تۈرى.
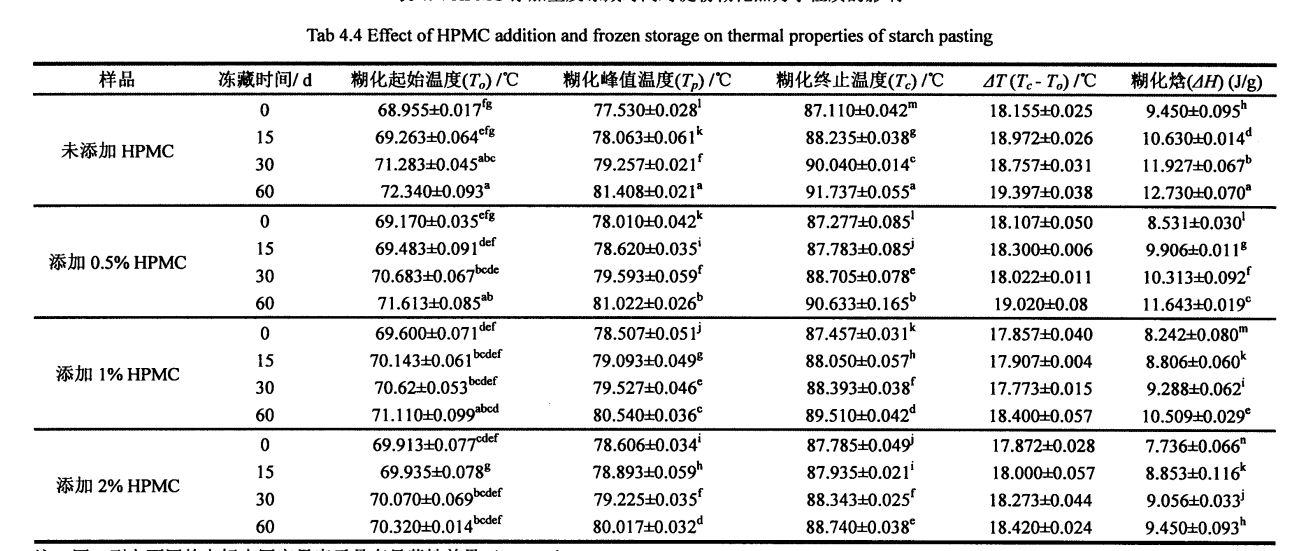
جەدۋەل مەغلۇبىيىتى Wedloid ئۈچۈن كۆرسىتىلگەندەك, HPMC نىڭ كۆپىيىشىدە, كلاسسىك بولكىسىدىن% 0.022 ± 28.021 ± 0.034 (% 2 نى قوشۇڭ HPMC), ئەمما 4H50 ±% 0.5 ±% 0.5 بولغان% 0.53 ا), 8.24A) ۋە 7% HPMC) ۋە 7% 2 http://fr (% HPMC قوشۇڭ). بۇ جوۋ, et A1 غا ئوخشايدۇ. (2008 بۇ ئاساسلىقى HPMC نىڭ سۇيۇقلۇق قەۋەتتىكى ياخشى گىدروفىلتلىق بولۇپ, چولپانغا قارىغاندا سۇ بىلەن بىرلەشتۈرۈش ئاسان. شۇنىڭ بىلەن بىر ۋاقىتتا, يۇقىرى تېمىلىق تېز سۈرئەتلىك ئاستا بولغان WPM نىڭ قېزىش مۇساپىسىنىڭ كىچىكلەشتۈرۈش مۇساپىسى HPMC نىڭ چولپانلاشتۇرۇش نىسبىتى ئۈزلۈكسىز يېكچىننىڭ تۆۋەنلىشىنى ئاشۇردى.
يەنە بىر تەرەپتىن, كاتتا ھايۋاناتلاشتۇرۇش, T p, tc, tc, tc, tc, △ t ۋە △ زال كۈچەيدى. كونكرېت قىلىپ, كراخكا چاقلىق قىلغىن% 1 ياكى% 2 لىك HPMC شىركىتى 68.51 7 (توڭلىتىش 0 كۈن) كۆپەيتىلگەن بولۇپ, 69.170 (توڭلىتىلغان 0 كۈن) دىن 71.613 گە يەتتى. 0.085 (توڭلىتىلغان ساقلاش 0 كۈن) 60 كۈن) 60 كۈندىن كېيىن, ناتارلۇق مېللاشتۇرۇشنىڭ ئېشىش سۈرئىتى HPMC يېرىلىش نىسبىتى HPMC قوشۇنىڭ ئېشىش سۈرئىتى تۆۋەنلىدى, مەسىلەن HPMC بولمىسا HPMC دىن HPMCH (توڭلىتىلغان ساقلاش 0 كۈن) دىن 81.028 دىن 81.028 دىن كېيىن. 408 ± 0.021 (توڭلىتىلغان ساقلاش 60 كۈن), CLOCH IN% 2 HPMC بىلەن 88.606 ± 90.034 ± 9.034 ± 9.034 ± 9.034 ± 9.034 ± 9.034 ± 9.034 ± 9.034 ± 9044 ± 9044 ± 9.034 ± 9.034 ± 9.034 ± 9.034 ± 90.037 ± 90.037 ± 60 كۈن). كۈنلەر); ئۇنىڭدىن باشقا, 8.450 ± 0.050 ± 12.095 (Next) دىن 12.070 ± 12.095 (next 0.075 ± 0.070 (Next (Next). 531 ± 0.030 (% 0.5 لىك) 11.242 ± 0.042 ± 28.042 ± 0.029 ± 0.0,0,0,0 دىن ئېشىپ كەتتى. توڭلىتىش مۇساپىلىك يۇمىلاق يۇلتۇزلۇق خۇسۇسىۋىلىنىش مەزگىلىدە يۇقىرىدا تىلغا ئېلىنغان چولپانلارنىڭ تەركىبىسىنىڭ ئاساسلىق سەۋەبى بولۇپ, قالسافور رايونىنىڭ پارچىلىنىشى (ئامورفۇئو رايونى) نى ۋەيران قىلىدۇ (ئامورفۇئو رايونى) نى ۋەيران قىلىدۇ. ئىككىسىنىڭ سۈزۈكلۈكنىڭ تۇغما خورلىشىشى, ھالبۇ بولسا چولپان قىچالىق كۆرگەزمىسىنىڭ تېمپېراتۇرىسى ۋە ھايۋانات يىلىمىلىق شىددكىدۇر. قانداقلا بولمىسۇن, سېلىشتۇرۇش ئارقىلىق بولىدۇ, بايقىغىلى بولىدۇكى, HpmC ۋە δt ۋە δt ۋە δt قاتارلىق چولپان يېغىنچى تۆۋەنلەيدۇ. HPMC نىڭ Insroach كىرىستال پوچتا قۇرۇلمىسىنىڭ نىسبەتنى ئۈنۈملۈك ساقلاپ قالالايدۇ, بۇ ئارقىلىق كرەنىك ھايۋانات تۇغقانلاشتۇرۇشنىڭ ئېشىشىنى چەكلەپ چۈشۈرەلەيدۇ.
4.3.7 I-IPMC قوشۇش ۋە باش كراخمالنىڭ نىسپىي خرۇستلىرىدىكى ساقلاش ۋاقتى
X. X-Ray Diquacenta (Xrd) X. X-Ray Divarcation, ماتېرىيالدىكى ئاتوم ياكى مولېكۇلا ياكى ماختىنىزاز ياكى موللاقنىڭ ئەگرى-مىزۇلغان تەتقىقات ئۇسۇلى. چۈنكى ستار قوتانلارنىڭ تىپىك خرۇستال قۇرۇلما سېلىنغانلىكى, XRD دائىم كراخمال كىرىستاللىق ياكى نىسپىي كىرىمىنى ئېنىقلاشقا ئىشلىتىلىدۇ.
رەسىم 4.6. AT AT in كۆرسىتىلگەندەك, كرېدىت كىرىپ كېتىش يۇقىرى پەللىسى ئايرىم-ئايرىم بەلگىلىمە بولغان ئورۇنلار ئايرىم-ئايرىم 170, 180, 190 ۋە 230, 190 ۋە 230 ۋە 230 ۋە 230 ۋە 230-يىللارغا جايلاشقان. بۇ كۆرسىتىپ تۆت, بۇغداي گراھىدنىڭ ئىچكى مۈلكى بولۇش سۈپىتى بىلەن خىروستاليال جەدۋىلى مۇقىم.
قانداقلا بولمىسۇن, يېقىشلىق ساقلاش ۋاقتىنى ئۇزارتىش بىلەن, ستارخاننىڭ بىر تۇغقان زاۋۇتى 20.42 دىن 36.42 دىن ئېشىپ كەتتى (HPMC, 0 كۈنلۈك ساقلاش ئورنى بولمايدۇ). 60 كۈنلۈك) بولۇپ, 25.75 + 0.21 + 0.21 (HPMC دىن ئېشىپ 32% Hupm (% 2 hpmc قوشۇلدى, 60 كۈن) (1-نومۇر) (A.6.B), بۇ ۋە TAO, ET A1 نومۇرى. (2016) ئۆلچەشنىڭ قائىدىلىرىنى ئۆزگەرتىش قائىدىسىنىڭ ئۆزگەرتىدىغان [173-1744]. بىر يۈزلىنىشنىڭ ئېشىشى ئاساسلىقى ئامورفوفوم رايونىنىڭ ھالاك بولۇشى ۋە كىرىستال رايونىنىڭ خىرۇستالنىڭ ئېشىشىغا كەلتۈرۈپ چىقىرىدۇ. ئۇنىڭدىن باشقا, توڭلىتىش مۇساپىسىنىڭ تېرمودىنامىكىلىق خاسلىشى نېمە بولۇپ, HPMC مۇناسىۋەتلىك كىرىستاللارنىڭ قۇرۇلما خاراكتېرلىك بۇزۇلۇشىنى كۈچكە ئىگە بولۇپ, ئۇنىڭ قۇرۇلمىسى ۋە خۇسۇسىيىتى بىر قەدەر مۇقىملىقىنى ساقلايدۇ.
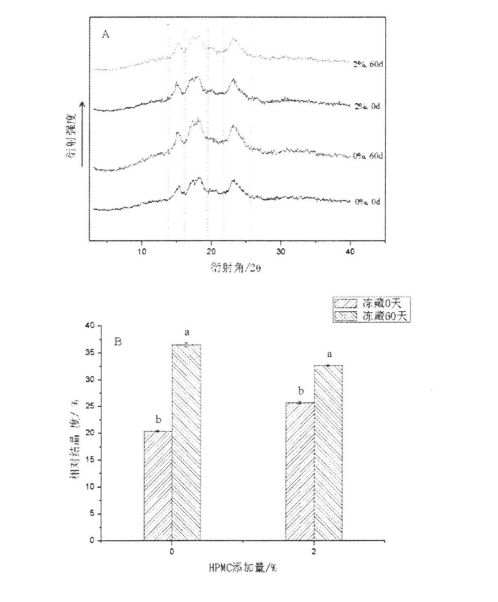
1-رەسىمدىكى HPMC قوشۇشنىڭ ئۈنۈمى ۋە XRD خۇسۇسىيىتىدە توڭلىتىلغان ساقلاش
ئەسكەرتىش: A بولسا x. رېنتىزىمنىڭ پەرقى B كراخمالنىڭ نىسپىي خرۇستاللىق نەتىجىسى
4.4 باب خۇلاسە چىقىرىش
ستارچ ياكى ياساشتىن كېيىن, خېمىرلاشقاندىن كېيىن, خېمىرلۇق ساپ ماددا (كونكرېت سۈپەت, تۇراقلىق, سەزگۈر, قاتارلىقلارنىڭ). ستار قۇرۇلمىسىنىڭ ئۆزگىرىشىدە توپ قۇرۇشقا تەسىر كۆرسىتىدۇ, بۇ ئۇنىڭ تەجرىبىسى HPMC قوشۇلدى. رولولوگىيە خۇسۇسىيىتىنىڭ ئۆزگىرىشى, خرۇموتىنامىس ۋە خرۇستال قۇرۇلما HPMC نىڭ ستار براكۇل قۇرۇلۇشى ۋە ئالاقىدار تالون ياساش ئۈنۈمىنى باھالاشتا ئىشلىتىلگەن. تەجرىبە نەتىجىسى كۆرسىتىلدى, 60 كۈندىن يىراق ساقلانغاندىن كېيىن, ستوننى قۇچاقلاش ئالاھىدىلىكى (يۇياقتىكى يېپىشقاقلىق, چىرىتىش قىممىتى ۋە ئەسلىگە كەلتۈرۈش كاپالىتى سەۋەبىدىن تەقدىرلەش, چىرىتىش سۈرئىتى ۋە بۇزۇلغان چولپاننىڭ مىقدارىغا كۆرۈنەرلىك ئېشىشىدىن ئاشتى. ھايۋاناتلاشتۇرۇش شىددەرىچە ئاشتى, شۇنىڭ بىلەن Starch قۇرىنىڭ Gel قۇدۇقى كۆرۈنەرلىك تۆۋەنلىدى. قانداقلا بولمىسۇن, بولۇپمۇ كلاسسىك ئاسما ئاسما كونتروللۇقى كونترول قىلىش ئۇسۇلى بىلەن% 2 HPMC بىلەن ئۆسۈپ, تۇغقان زىيادە كېتىشى ۋە كرايىقلىقى ۋە گرېتسىيەلىكلەرنىڭ ئۆزگىرىشىنى ۋە ئالتۇن دۆلەتلىرىنىڭ ئۆزگىرىشىنى ۋە ئالتۇن دۆلەتلىرىنىڭ ئۆزگىرىشى ۋە قىستاڭچىلىق قۇرۇلۇشىنىڭ توغرىسى شۇنى چۈشىدىن دېرەك بېرىدۇ.
5-باب HPMC نىڭ ئۈنۈمى ئېچىلغان ساقلاش شارائىتىدىكى يېدىنىڭ ھايات قېلىش رىقابىتى ۋە ئېچىلىش پائالىيىتىدىكى تەسىرى
5.1 نىزامى
ئېچىدى بىر قاتار يىلتىزىدىن بىرەيل مىكرو ئورگانىزىمغا چوراندىل, ئۇنىڭ سۈنىسى مودا بولۇپ, مويولۇم قوشقۇچ, Milliret تىپى, ئۇنىڭ ئوزۇقلۇق تىپى Pasultorotic مىكرو مىكرولىسى مىكرو ئوربورۋور. WEAREOBIC شارائىتى ئاستىدا, ئۇ ھاراق ۋە كۈچ چىقىرىدۇ, ئۇنىڭدا كاربون تۆت ئوكسىد, سۇ ۋە ئېنېرگىيە ئىشلەپچىقىرىش.
شەرەپلىك ئۇن مەھسۇلاتلىرىدە ئېچىلىشچان پروگراممىلاردا كەڭ دائىرىدە قوللىنىشتا بولىدۇ. ئۇيۇش سۇيۇقلۇقى ئاساسلىقى سۇسلرولىگاللىق باكتېرىيەنى ئىشلىتىپ, نەپەسلىنىش كاربون تۆت ئوكسىد بولۇپ, نەپەسلىنىشتىن كېيىن. ئىشلەپچىقىرىلغان كاربون تۆت ئوكسىد كېسەللىكى خېمىرنى بوش, خېلى ۋە ئاشپەز قىلالايدۇ. شۇنىڭ بىلەن بىر ۋاقىتتا, يېقىشلىق ئويلىنىش مەھسۇلاتنىڭ يېقىشلىق داۋالىنىشنىڭ مەھسۇلاتنىڭ ئوزۇقلۇق قىممىتىنى ياخشىلاپلا قالماي, مەھسۇلاتنىڭ تەملىك ئالاھىدىلىكلىرىنى كۆرۈنەرلىك ئۆستۈرەلەيدۇ. شۇڭلاشقا, ھەپتىنىڭ ھايات قېلىش نىسبىتى ۋە سېنىڭ ئاخىرقى مەھسۇلاتنىڭ سۈپىتىگە مۇھىم تەسىر كۆرسىتىدۇ (كونكرېت ھەجاش ۋە تەم قاتارلىقلارنىڭ سۈپىتىگە (كونكرېت ئاۋاز, يول ۋە تەم قاتارلىقلارنىڭ سۈپىتىگە تەسىر كۆرسىتىدۇ [175].
توڭلىتىلغان ساقلاش مەسىلىسىدە, يىللار مۇھىت بېسىمىغا تەسىر كۆرسىتىدۇ ۋە ئۇنىڭ ھاياتىي كۈچىگە تەسىر كۆرسىتىدۇ. توڭلىتىش نىسبىتى بەك يۇقىرى بولغاندا, سىستېمىدىكى سۇلار بىلەن تېز ئۆگەنگەندە, ئېچىتى, ئېچىتى, ئېچىتى, شۇ ئارقىلىق ھۈجەيرىلەرنى سۇدىن قوغلاپ چىقىرىشىدىكى ھۈجەيرىلەرنى كەلتۈرۈپ چىقىرىدۇ. توڭلىتىش نىسبىتى بەك يۇقىرى بولغاندا. ئەگەر بەك تۆۋەن بولسا, مۇز كىرىستاللىرى بەك چوڭ بولىدۇ, ئېچىتقۇلار سىقىلىدۇ ۋە ھۈجەيرە تام بۇزۇلىدۇ. ھەر ئىككىسى ئېچىتقۇنىڭ ھايات قېلىش پائالىيىتىنى تۆۋەنلىتىدۇ. بۇنىڭدىن باشقا, نۇرغۇن تەتقىقاتلار تولىمۇنچىلىش جەھەتتە يېرىلىپ كەتكەن بولسىمۇ, ئۇلار تارتۈپ تۇرغۇنتۇئېن قولغا كەلتۈرغانلىقىنى ئىسپاتلايدۇ, بۇ ئارقىلىق سىيرىلمىغان گۋاتېرىدېل گۇرۇپپىسىغا قارىغاندا ئۆرلەيدۇ, بۇ ئارقىلىق يېلسانت مەھسۇلاتلىرىنىڭ سىرتقى ئۆرلىشىنى يوقىتىدۇ, نەتىجىدە كاترۇس مەھسۇلاتلىرىنىڭ سۈپىتىنى تۆۋەنلىتىپ, 176-177] نى ئازايتىدۇ.
چۈنكى HPMC نىڭ كۈچلۈك سۇنى تۇتۇپ ساقلاش ۋە سۇ ساقلاش ۋە سۇ ساقلاش ۋە سۇ ساقلاش سىستېمىسى بار, ئۇنى خېمىر سىستېمىسىغا قاچىلاش ۋە مۇز ئۈزۈمىنىڭ شەكىللىنىشى ۋە ئېشىشىنى چەكلىگەنلىكى ئۈچۈن. بۇ تەجرىبىسىدە ئوخشىمايدىغان مىقداردىكى HPMC ساقلانمىلارغا ئاساسەن ئوخشىمىغان مىقداردىكى مىقداردا ۋاقىت قوشۇلدى, ھەر قانداق بىر مەزگىلدىن كېيىن, مەلۇم بىر مەزگىلدىن كېيىن, بىپتىتېنلىق, باھا, تېما پائالىيىتى ۋە يېۋاتېشتۇدىرىئېنگېنوبىل زىيارەتكە توسىلى قىلىندى.
5.2 ماتېرىيال ۋە ئۇسۇل
5.2.1 تەجرىبە ماتېرىياللىرى ۋە ئەسۋابلىرى
ماتېرىيال ۋە ئەسۋابلار
پەرىشتە ئاكتىپ قۇرۇتۇلدى
BPS. 500 ئادەم توختىماي تېمپېراتۇرا ۋە نەملىك ساندۇق
3M قاتتىق فىلىم مۇستەملىكىسى تېز سۈرئەتلىك سىناق سىنىقى
Sp. مودېل 754 UV Squiprophootometter
Ultra-Full Stertery مەشغۇلات جەدۋىلى
KDC. 160 سائەت يۇقىرى سۈرئەتلىك توڭلاتقۇنىڭ مەركىزى
Zwy-240 تۇراقلىق تېببىي تېبابەتچى
Bds. 200-بىئولوگىيىلىك مىكروسكوپ
ئىشلەپچىقارغۇچى
پەرىشتىلەر fo., ltd.
شاڭخەي جخېڭ ئىلمىي ئىلمىي ۋاگېن چەكلىك شىركىتى چەكلىك.
ئامېرىكا 3M شىركىتى
شاڭخەي Specorm ئىلمىي ئەسۋاب شىركىتى بىرلەشمە شىركىتى چەكلىك شىركىتى LTD.
جياڭسۇ تۇڭج قىلىش ئۈسكۈنىلىرى چەكلىك شىركىتى LTD.
ئەنخۇي جوڭكۈر Zhongjia ئىلمىي ئەسۋاب COO., LTD.
شاڭخەي جۇلىڭلىق ئىچكى سىما ئىشلەش CO., LTD.
چۇڭچىك ئاپتوماتىك ئوپتىكىلىق ئەسۋاب چەكلىكچىسى.
5.2.2 تەجرىبە ئۇسۇلى
5.2.2.1 ئېچىتلىق سۇيۇقلۇق تەييارلاش
ئېغىرلىقى 3 لەر ئاكتىپ قۇرغاق ئېچىۋېتىلىدۇ, ئۇنى 12 ml لىق% 9 mlineruge نۇرىغا ئايلاندۇرۇڭ, ئاندىن 27 ml. ئاندىن, تېزلا يۆتكىلىدۇ. 18 ° C دىكى توڭلاتقۇدا ساقلاڭ. 15 d, 30 d, 60 d مۇز تېيىلىش ساقلاش بوشلۇقى, ئەۋرىشكە سىناق قىلىش ئۈچۈن ئېلىنغان. % 0.5,% 1 نى قوشۇڭ,% 2 hpmc (w / w) ئاكتىپ قۇرغاق شاۋقۇن كۈچىنىڭ مۇناسىپ نىسبىتىنى قوشۇڭ. بولۇپمۇ HPMC تاقابىل تۇراپ, ئۇلتراۋىۋىمامىسى ۋە دېزىنفېكسىيە قىلىش ئۈچۈن چوقۇم ئۇلترا چىراغ ئاستىدا 30 مىنۇت دىققەت قىلىش كېرەك.
5.2.2.2 قېچىش ئېگىزلىكى
Meziani, et A1 نى كۆرۈڭ. (2012) تەجرىبە ئۇسۇلى [17 نەقىل ئېلىنغان, ئازراق ئۆزگەرتىش. توڭلىتىلغان خېمىرنىڭ ئېغىرلىقى 50 مىللىمېتىرلىق خېمىرغا 50 ML رەڭلىك تۇغۇلغان بالداققا كىرىپ, ئۇنى ئۈزلۈكسىز ئېگىزلىكتە قىلىپ, ئۇنى مىلادىدىن باشلاپ 85 ° Chi دىن توغرا قىلىڭ (30 ° C) نىڭ جازىسىنى مىللىمېتىردا ئۆلچەڭ (ئونلۇق نۇقتىدىن كېيىن). دەلىل-ئىسپاتلار ئۈچۈن ئەۋرىشكە ئۈچۈن يۇقىرى چەك بىلەن تەڭ ياكى 4 ياكى 4 نومۇرغا ماس كېلىدىغان ئون ئىككى ياكى 4 نومۇرنى تاللاڭ. مەسىلەن, 900), ئۆلچەملىك ئېگىزلىك قىممىتى ئوتتۇرا ھېساب بىلەن. ھەر بىر ئەۋرىشكە ئۈچ قېتىم تىرناق ئىدى.
5.2.2.3 cfu (مۇستەملىكىسى شەكىللىك ئورۇنلار) ھېسابلاش
ئۇسۇلنىڭ ئېغىرلىقى 1 گرام يىپنىڭ نورمال تۇرۇبىسىغا كىرگۈزۈپ, زېھنىنىڭ ئادەتتىكى تارىخىغا ئاساسەن ئۇنى تولۇق تورغا قوشۇڭ, زېھنى قەدەر دەرىجىدىن تاشقىرى ئېغىرلىقنى 101 قىلىپ خاتىرىلەڭ, ئاندىن ئۇنى بىر قاتار مەركەزلەشكەنلىك دەرىجىسى 10'1 گە يېتىدۇ. يۇقارقى تۇرۇبانىڭ ھەر بىرىدىن 1 مىللىمېتىرلىق سۇيۇقلۇق سىزىڭ, ئۇنى 3M يېتىل تېزدىن يەتكۈزۈش (جىددىيلىك بىلەن ئېكراندا) ۋە 3m كۆرسىتىلگەن مەدەنىيەت تەلىپىنى بىر 25 ° C ئىنكۇزغا قويۇڭ. 5 d ئاندىن مەدەنىيەتنىڭ ئاخىرلاشقاندىن كېيىن ئېلىپ بېرىلىپ چىقىڭ, ئالدى بىلەن مۇستەملىكىلى مور باغفولوگىيەلىك مور باغچىسىنىڭ مۇستەملىكىسىنىڭ مۇستەھكەم ئالاھىدىلىكىگە سېلىشتىكى ۋە مىكروسكوچنىڭ باغلىنىشىغا ۋە مىكروسكوچنىڭ ئورنىنى ئالدى-يالىياڭ. ھەر بىر ئەۋرىشكى ئۈچ قېتىم تەكرارلاندى.
5.2.2.4 Gluthione مەزمۇنىنى بەلگىلەش
ئاللومان ئۇسۇلى گىلتاتيوئون مەزمۇنىنى بەلگىلەش ئۈچۈن ئىشلىتىلگەن. پرىنسىپ بولسا گلامۇتيون ۋە ئاللوكىياننىڭ ئىنكاس مەھسۇلاتى بولۇپ, ئاللوكىكاننىڭ رېپوراندا سۈمۈرۈلۈش نىسبىتى 305 nl. مۇئەييەن بېكىتى: ئاندىن 1000 مىليارد دوللارلىق يېتىلدۈرىدۇ, ئاندىن 0.2GEGEG WETT غا 1 MLL / ML قوشۇڭ بۇ, ياخشى ئارىلاشتۇرۇپ, 6 مىنۇت سۆزلەڭ, پەقەت 1 مىنۇتنى قوشۇش ئۈچۈن ,HO دىن 1 MM نى قوشۇش 1 ML, پاكىز ئارىلاشتۇرۇلغاندىن كېيىن UV SpectOpoMETER. Gluththione مەزمۇنى ئۆلچەملىك ئەگرى سىزىقتىن ھېسابلىنىدۇ. ھەر بىر ئەۋرىشكە ئۈچ قېتىم تىرناق ئىدى.
5.2.2.5 سانلىق مەلۇمات بىر تەرەپ قىلىش
تەجرىبە نەتىجىسى ئاساسەن دېگۈدەك 4 ئۆلچەملىك ياتلىشىش سۈپىتىدە ئوتتۇرىغا قويۇلغان, ھەر بىر سىناقتا كەم دېگەندە ئۈچ قېتىم تەكرارلاندى. پەرغغالانى تەھلىل قىلىش ۋە ئەھمىيىتى 0.05 ئىدى. گرافىكلارنى سىزىش ئۈچۈن كېلىپ چىقىشنى ئىشلىتىڭ.
5.3 نەتىجە ۋە مۇنازىرە
5.3.1 HPMC قوشۇلۇش نىسبىتى ۋە سەككىز ساقلىنىش ۋاقتى
خېمىرنىڭ بوي ئېگىزلىكى ئېچىنىشلىق گاز ئىشلەپچىقىرىش پائالىيىتى ۋە خېمىرىلىك تور قۇرۇلمىسىنىڭ بىرلەشمىسىگە دائىم تەسىرلىنىدۇ. بۇنىڭ ئىچىدە, فېم فىل ئامراق ئادەمنىڭ گاز چىقىقى ۋە ئىشلەپچىقىرىش ئىقتىدارىغا ئېغىر تەسىر كۆرسىتىشى بولۇپ, يېقىلىق تەبىئىي ئىشلەپچىقىرىش مىقدارى بار بولغان ئوتتۇز تېز مەھسۇلاتنىڭ سۈپىتىنى تۆۋەنلەيدۇ. يېمەننىڭ قىلىش ئىقتىدارى ئاساسلىقى تاشقى ئامىللارنىڭ ئىپادىسى ئاساسلىقى تاشقى ئامىللارنىڭ ئىپادىسى ئاساسلىقى بار (مەسىلەن كاربونلۇق مەنبەنىڭ, تېمپېراتۇرا, PM قاتارلىقلارنىڭ ئۆزگىرىشى ۋە ئىچكى ئامىللار (ئېشىش دەۋرى, مېتابولىزم ئېنزىممۇبىر قاتارلىقلار.

5.1-رەسىم HPMC قوشۇشنىڭ سەككىزىنچى ۋە سەككىز ساقلاش بوشلۇقىنىڭ ئېگىزلىكى
5.1 رەسىمدە كۆرسىتىلگەندەك, HPMC نىڭ كۆپىيىۋاتقاندا, خېمىرنىڭ ئىسپاتى 4.274-2.1m دىن 4.274 سانچە ئۆرلەيدۇ. -0.12 سانتىمېتىر (% 0.5) قوشۇلدى), 4.3140.19 سانتىمېتىر (% 1 hpmc قوشۇلدى) ۋە 4.594-0.19 سانتىمېتىر) بۇ بەلكىم HPMC قوشۇلۇشى سەۋەبىدىن بولۇشى مۇمكىن, ئۇتتۇرۇش خۇسۇسىيىتىنىڭ خۇرغىتلىرى (2-بۈمە) قانداقلا بولمىسۇن, 60 كۈن توڭلىتىلغاندىن كېيىن, خېمىرنىڭ دەلىل-ئاشكارە پەردىسى ئوخشىمىغان دەرىجىدە ئوخشىمايدۇ. كونكرېت قىلىپ ئېيتقاندا, HPMC دىن HPMC دىن HPMC دىن كونترول قىلىشنىڭ ئىسپاتى (0 دىن 0.15 cm (توڭلىتىلغان ساقلاش 60 كۈن) ھالبۇكى ئۇلاش% 0.5 دىن% HPMC بىلەن% 0.5 + 0.12 سانتىمېتىرغىچە كۆپەيتىلدى (Funzen ساقلىغۇچ) دىن 3.424-0.2.2.2 سانتىمېتىر (توڭلىتىلغان ساقلاش) دىن تۆۋەنلىدى. 60 كۈن) ھاليېكى% 1 HPMC بىلەن 4.314 ئۆلچىمىنى ئازايدى (0 كۈنلۈك ساقلاش) دىن 3.774-0.170.10 (توڭلىتىلغان ساقلاش 60 كۈن) خېمىرنىڭ% 2 hpmc work weked weked. چاچ ئېگىزلىكى 4.594-0.17 سانتىمېتىر (0 كۈنلۈك ساقلاش) دىن 4.09- دىن 4..16 سانتىمېتىر (توڭلىتىلغان ساقلاش مىقدارى) دىن 4.09. VPMC نىڭ قوشۇلۇشىنىڭ كۆپىيىشىدە, خېمىرنىڭ دەلىل-ئىسپات ئېگىزلىكىدىكى تۆۋەنلەش دەرىجىسى تەدرىجىي تۆۋەنلەيدۇ. بۇ ئوچۇق-ئاشكارە ساقلاش ئاستىدا, HPMC تور قۇرۇلمىسىنىڭ ئۆسۈش يۈزىدىن ئېشىپ كەت, شۇنداقلا ئۇنىڭ ھايات قېلىش نىسبىتىنىڭ نىسبەتنى ئىگىلەپلا قالماي, ئېچىتقۇنىڭ ھايات قېلىش نىسبىتى ئۆسمىسىنى ساقلاپ قالالايدۇ, ئۇنىڭ بۇ يەردە ئېچىلغان ئاۋازنىڭ سۈپەت ناچارلىشىشىنى ئازايتالايدۇ.
5.3.2 IPMC قوشۇلۇشى I-IPMC قوشۇلۇشى ۋە يىلان ھايات بولۇش نىسبىتى توغرىسىدىكى ۋاقتىنچە
توڭلىتىش مەسىلىسىدە توڭلىتىلغان سۇدا مۇز خرۇستالغا ئايلانلانغاندىن كېيىن, ئېچىتقۇزىقى ھۈجەيرىسىنىڭ سىرتىدىكى قۇتۇپ نۇقسانلىرىنىڭ ئىزچىكى, شۇنداقتىللۇتنىڭ ئىزاھلىنىشى ۋە ھۈجەيرىلىرى ۋە ھۈجەيرىسىنىڭ ئۆزگىرىشى ۋە قىلىنىدىغان بېسىمنىڭ ئاستىدا. تېمپېراتۇرا تۆۋەن تېمپېراتۇرىدا ئۇزۇن ۋاقىت چۈشۈۋاتقاندا ياكى ئۇزۇن مۇددەت ئازراق مۇز كىرىستال, بۇ ئېچىتى, بۇ يېتىلىشنىڭ توپلاش قۇرۇلمىسى كۆرۈنۈشى - ئازايتىش ماددىلىرىنىڭ بۇزۇلۇشى - يېقىلغۇسىز, ھەتتا ئۆلۈش كېرەك. شۇنىڭ بىلەن بىر ۋاقىتتا, مۇھىت بېسىمى ئاستىدا يىلانلا, ئۆزىنىڭ مېتراكولى پائالىيىتى ئىشلەپچىقىرىلىدۇ, يەنى فوتنىڭ ئېچىلۇپىيىسىنىڭ ئويۇش سۇيۇقلۇقىنى تۆۋەنلىتىدۇ.
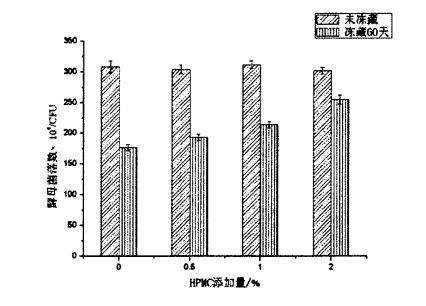
5.2-رەسىم HPMC قوشۇلۇشى ۋە ھاياتنىڭ ھايات قېلىش نىسبىتىدىكى ساقلانمىلار
5.2-رەسىمدىن كۆرۈنگىلى بولىدۇ. بۇ خىل Heitmann, زەننىىن, & quenden (2015) [180] [180]. قانداقلا بولمىسۇن, 60 كۈن توڭلىتىشتىن كېيىن, يېنغىرلىق مۇستەملىكى تەخمىنەن ئېچىنىشلىق مۇستەملىكى تەخمىنەن تۆۋەن, 3.08x10⁶ CFU نىڭ سانى تۆۋەنلەپ, 3.76x10⁶ CF دىن 1.76X10⁶ دىن ئېشىپ كەتتى (HPMC نى قوشمايدىكەن) 3.04x10⁶ دىن 193x106 دىن 193X106 دىن (% 0.5) نى قوشىدۇ. 3.12x10⁶ CFU دىن 2.14X10⁶ CFU غا (% 1 HPMC) دىن تۆۋەنلىدى. 3.02x10⁶ CFU دىن 2.55x10⁶ CFU دىن تۆۋەنلىدى (% 2 HPMC نى قوشتى. سېلىشتۇرۇپ, توڭلىتىش مۇھىتىنىڭ مۇھىت بېسىمىنىڭ تۆۋەنلىشىنى كەلتۈرۈپ چىقىرىدىغانلىقىدىن دېرەكلەنگەن ئايروپىلانىنى ئىگىلەيدىكەن, ئەمما HPMC دىن باشقا, مۇستەھكەم سانائىتىنىڭ تۆۋەنلىگەنلىكىدىن ئېشىپ كېتىدۇ. بۇ HPMC نىڭ توڭلىماقتا يېقىشلىق شارائىتتا كەچ ئىكەنلىكىنى تېخىمۇ ياخشى ساقلىيالايدىغانلىقىنى كۆرسىتىدۇ. قوغداش مېلىپى, ئادەتتە ئىشلىتىلگەن دەرىجىدىكى سازاقچىلىرىنىڭ شەكىللىنىشى ۋە ئېشىش سۈرئىتىنى قوزغىتىش ۋە تۆۋەن تېمپېراتۇرا مۇھىتىنىڭ بېسىمى بىلەن يېقىشلىق كىشىلەر بىلەن ئوخشاش بولۇشى مۇمكىن. 5.3-رەسىم 5.3 بولۇپ, تەييارلىق ۋە تېلېۋىزىيەگە قارىغاندا تەييارلىق ۋە مىكرو تەكشۈرۈشتىن كېيىنكى سېتىلىش سىناقنى تېز ئۆگەنگەن سىنئا سىناقنى نەزەرگە سالغان رەسىمگە تاشلاش ۋە Coupsicology.
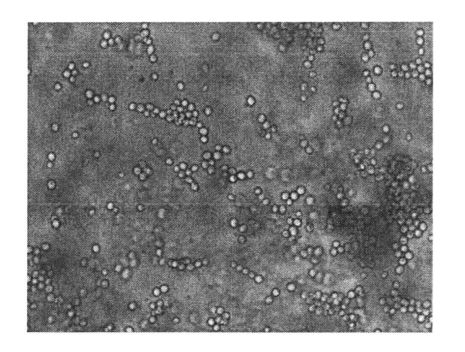
5-رەسىم سېرىق رەڭلىك
5.3.3 HPMC قوشۇش ۋە يېقىشلىق مەزمۇندىكى گىلەمتسىيوئوننىڭ مەزمۇنىدا مۇزلاش ۋاقتى
Gluththione Glutamic كىسلاتاسى ۋە گولكور ۋە ھەمجىننىڭ ئىككى خىل قىسمى. ئازايدى ۋە ئوكسىدلانغان. ئېچىلغان ھۈجەيرىلەر قۇرۇلمىسى پالەچ بولۇپ, ھۈجەيرىسىنىڭ ئەمەسلىكى, ھۈجەيرىلەر كۆپىيىدۇ, ئۇ ئاندىلالىشىش Gluthathione ھۈجەيرە قاتلىمىغا تارقىتىلىدۇ. قىزىلىدىغان قىرىق, بۇ يېمەرسى ئىقتىسادىنىڭ ھالقىغان ئاقسىلنىڭ چوڭ يۆنىلىشىدە تەشكىللەنگەن ھالدا ئۇلارنى بۇزۇۋېتىپ, ھەقسىز سۇلف سەللە گۇرۇپپىسىنىڭ (.sh) شەكلىدە چۈشۈلىدۇ (.sh) شەكلىدە كەم بولسا بولمايدۇ. ئاخىرىدا مۇقىملىق ۋە سەمىمىيەت, ئەگەر ناچار تەنھەرىكەت مەھسۇلاتلىرىنىڭ ناچارلىشىشىنى كەلتۈرۈپ چىقىرىدۇ. ئادەتتە مۇھىتتا ئېغىر تۇرۇبا, يۇقىرى تېمپېراتۇرىسى, يۇقىرى تېمپېراتۇرا, ياخشى ئوسموستكسى قاتارلىقلار), يىلخىل ھالدا ئۆزىنىڭ مېتاۋىر ئىقتىدارىنى ئاشۇرۇۋېتىدۇ ھەمدە بېسىمغا قارشى تۇرۇش كۈچىيىشى ياكى بىرلا ۋاقىتتا تەڭرىنى ئاشۇرۇۋېتىدۇ. مۇھىت شارائىتى ئۇنىڭ كۆپىيىشى ۋە ئاكتىپلىنىپ قايتا قوزغىتىشقا ماس كەلگەندە, مېتابولىزم ۋە پەيدا بولۇش ھاياتىنى ئەسلىگە كەلتۈرگەندە. قانداقلا بولمىسۇن, ئۇزۇن ۋاقىت توڭلىلىش مۇھىتىدا ساقلانمىسا, يەنىلا كۈچلۈك مېتابولىزىم ياكى كۈچلۈك مىدۋىتلار يەنىلا ئۆلىدۇ.
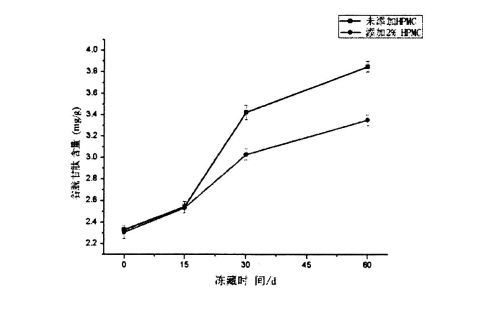
5-رەسىم 54-رەسىم
5.4-رەسىمدە كۆرسىتىلگەندەك, كىڭلاشتۇرغۇچ HPMC قوشۇلمىغان مەيلى HPMC قوشۇلغان ياكى يوق يېرىلىشنىڭ قانداق بولۇشىدىن قەتئىينەزەر, ئوخشاشلىقتىكى قوشۇلۇش مىقدارىنىڭ كۆرۈنەرلىك پەرقى يوق. بۇ بەلكىم خېمىر ياساش ئۈچۈن ئىشلىتىلىدىغان بارلىق ئاكتىپ قۇرغاق شەرىتە, ھەشەمەتلىك بولۇشنىڭ بېسىمغا قارشى تۇرۇش ۋە كەڭ قورساقلىق بار. تۆۋەن تېمىنىڭ توڭلىتىش ئەھۋالى ئاستىدا, ھۈجەيرىلەر ئۆلىدۇ, ئاندىن گۇلتاتييون ئېلان قىلىنغان, بۇ پەقەت ئېچىلىشنىڭ ئالاھىدىلىكىنىڭ ئالاھىدىلىكىگە مۇناسىۋەتلىك. ئۇ سىرتقى مۇھىت بىلەن مۇناسىۋەتلىك, ئەمما HPMC يەنە ھېچقانداق مۇناسىۋىتى يوق. شۇڭلاشقا, گولد دەرىخىنىڭ مەزمۇنى مۇزلىنىۋاتقان كۈندىن باشلاپ, ئىككى كۈن ئىچىدە كۆرۈنەرلىك پەرق يوق. قانداقلا بولمىسۇن, يېقىشلىق ۋاقىتنىڭ كۆپىيىشىدە, يېغىش شىركىتىنىڭ ئۆسۈپ قېلىشىنى يەنە كېڭەيتىشتىپ, يېقىملدۈرۈشنىڭ ئېشىشى HPMC دىن تۆۋەنلىدى, 0.040MG / G (توڭلىتىلغان ساقلاش 60 كۈن) يېخىملىقلىق سۇيۇقلۇق% 2 HPMC نى كېڭەيتكەن بولسىمۇ, ئۇنىڭ گىلسىشيەنمۇ مەزمۇنى 2.307 + 0307 + 0307 + 0 دىن بۇرۇنقىچە .058 Mg / G (توڭلىتىلغان ساقلاش 60 كۈن) ئۆرلىدى. بۇ جەھەتتىن, HPMC تۈۋرۈكلىرىنى قوغداش ۋە ئۆلكىنىڭ ئۆلۈشىنى ئازايتالايدىغانلىقىنى, يىلنى كلېئىتىنىڭ سىرتىغا تارقىتىلغان Gluthiene نىڭ مەزمۇنىنى ئازايتالايدىغانلىقىنى كۆرسىتىپ بەردى. ئاساسلىقى HPMC بىر مۇز خرۇستال سانىنى ئازايتالايدۇ, بۇ ئارقىلىق مۇز خرۇستالنىڭ بېسىمىنى ئۈنۈملۈك تۆۋەنلىتىدۇ ۋە شەيتېرئوتېننىڭ يوقىلىش نىسبىتىنى ئۈنۈملۈك تۆۋەنلىتىدۇ.
5.4 باب
ئېچىدى ئوپېراتسىيە مەھسۇلاتلىرى كەم بولسا بولمايدىغان ۋە مۇھىم تەركىب, ئۇنىڭ ئەڭ تۆۋەن دەرىجىلىك مەھسۇلاتنىڭ ئاخىرقى مەھسۇلاتنىڭ سۈپىتىگە بىۋاسىتە تەسىر كۆرسىتىدۇ. بۇ تەجرىبە ئىچىدە ئېچىت, توڭلىتىلغان خېفنىڭ ئېچىلدىكى توپانىڭ قوغدىلىنىشى فوتېن فامىلىلىكنىڭ ئوخشىمىغان hpmc قاتارلىقلارنىڭ ئىشلىتىلىشى, ئېچىتقۇ ھەشەمەتلىك كورېيەنىڭ ھەر خىل hPmc سان قاتارلىقلىرى ۋە يېتىشىۋېلىش مەزمۇنىنى توڭلىتىلغان. سىناق قىلىش ئارقىلىق, HPMC نىڭ ھوسۇلىنىڭ ھوسۇلىنىڭ ياخشىلىنىشىنى تېخىمۇ ياخشى ساقايتىپ, 60 كۈندىن كېيىن خېمىر نې توڭ قىلىنغاندىن كېيىنكى دەلىل-ئىسپات دەرىجىسى تۆۋەنلەيدۇ, شۇنداق بولغاندا ئاخىرقى مەھسۇلاتنىڭ كونكرېت بېلىقىنىڭ كاپالىتى بىلەن ئازايتىدۇ. ئۇنىڭدىن باشقا, HPMC نىڭ ئۈنۈملۈك بولسىمۇ, چۈنكى HPMM نىڭ ئۈنۈملۈك تۆۋەنلىشىدە تېخىمۇ ئۈنۈملۈك گۇلتسىزىمنىڭ تۆۋەنلىشىگە ئەگىشىپ, بۇ ئەۋەتىلگەن گۇناھلىرىمنىڭ زىيىنى خېمىرتۇرۇش نىسبىتىنى ئۆستۈردى. بۇ ئارقىلىق GlithioNe نىڭ زىيىنىنى خېدىتكە چۈشتى. بۇ HPMC مۇز كىرىستالنىڭ شەكىللىنىشى ۋە ئۆسۈشىنى چەكلەيدۇ دەپ كۆرسىتىپ بېرىدۇ.
يوللاش ۋاقتى: OCC-08-2022